Graph theory for computational physiscs
Graph theory has strong correspondences with the framework of computational physics
We have uncovered a deep correspondence between the classical description of computational physics and graph theory. Properties of computed solutions to stattionary or (steady-state) and dynamical systems such as solvability, time steps or changes in key quantities, reversibility/irreversibility, periodic solutions, and many others, find direct analogues in the connectedness, edge weights, (un)directedness, cycles, etc. of graph theory. Some of the analogies are due to definitions in graph theory, while others are properties, and even theorems. In addition to making this theoretical connection, we have placed large-scale computed solutions to a range of problems in materials (linear and nonlinear elasticity, phase transformations) and biophysics (patterninbg and morphogenesis) in this framework. This has allowed exploration and analysis of large ensembles of solutions to these systems, leading to insights that were not otherwise accessible.
- Papers:
- A graph theoretic framework for representation, exploration and analysis on computed states of physical systems
R. Banerjee, K. Sagiyama, G.H. Teichert, K. Garikipati
[available on arXiv]
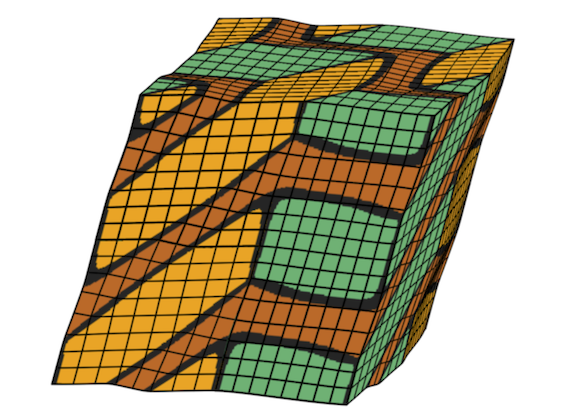
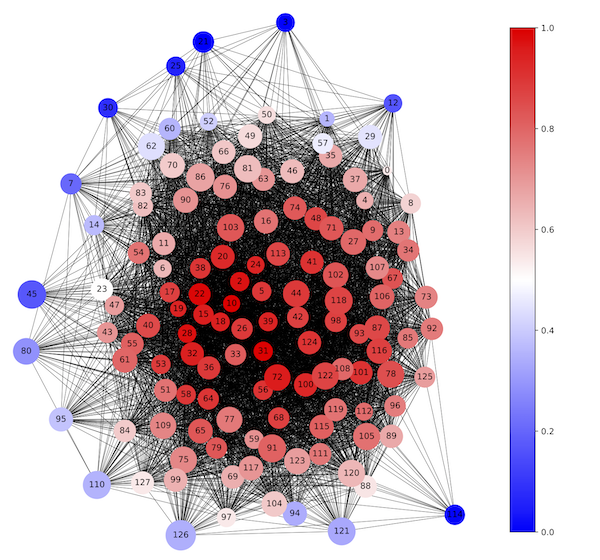
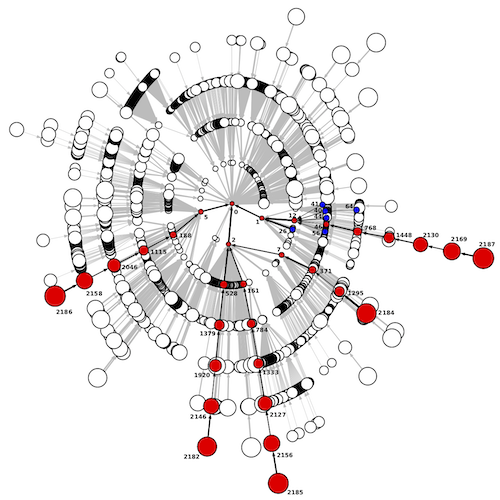
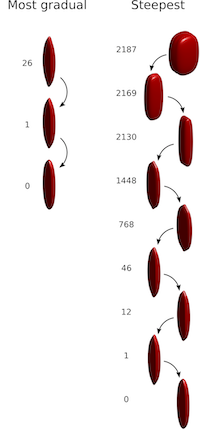
Strain states attained by the martensitic solid (extreme left with three variants delineated), computed by a gradient-coercified theory of non-convex, nonlinear elasticity, are mapped on to a 128-vertex graph (second from left). The area of each vertex is proportional to the norm of the strain state it represents, and its color corresponds to its eigenvector centrality, which is a measure of the accessibility of that state from others. On the extreme right are precipitate morphologies in a Mg-Y alloy, shown evolving to a minimum free energy state determined by a combination of nonlinear elasto-growth mechanics, surface integrals of interfacial energy and chemistry, mapped on to a tree graph with the equilibrium, free energy-minimizing state as its root. Here, vertex area is proportional to the free energy. The sequence of transformations with the steepest and most gradual free energies on average appear highlighted as paths on the graph.
[Click images to enlarge