| Java Not Activated | Java Not Activated | Java Functional |
 |
Blank Area
or message: Image requires a Java enabled browser
|
 |
| KiNG Inactive | KiNG Inactive | KiNG Full Functional |
|
Bound & Unbound Tyrosine Kinase Domain of FGFR 1 by Larry P. Taylor, Ph. D.
Feedback appreciated; please send comments to: Email: lpt Molecular & Behavioral Neuroscience Institute The University of Michigan Ann Arbor, MI |
My University Home Harris Links Chemistry / Modeling Links
FGF Site: FGF Intro Nomenclature Notes References FGF Sequences FGFR Sequences
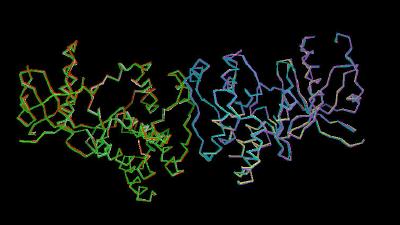
Backbone Comparisons of the Tyrosine Kinase Domain of Fibroblast Growth Factor Receptor 1
The crystal structure of each
molecule (the unbound Tyrosine Kinase region and this region bound to inhibitors
PD-173074 or SU-4984 ) shows a unit cell dimer .(Kinemage
1). The backbones from crystal structures of the tyrosine kinase domain of FGFR 1 and the same region when bound to inhibitors PD-173074 and
SU-4984 show no distinct differences.
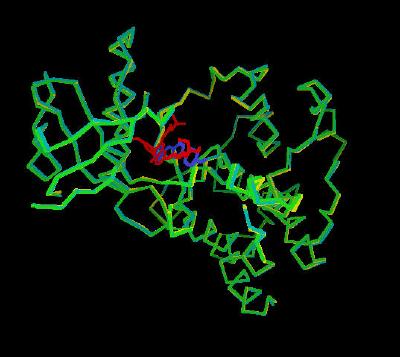
The side chains, with the exception of Lys-514 (which moves to accommodate the incoming methoxy group of PD-173074), also appear relatively unchanged upon inhibitor binding to the tyrosine kinase domain of FGFR1.
(Kinemage 2).
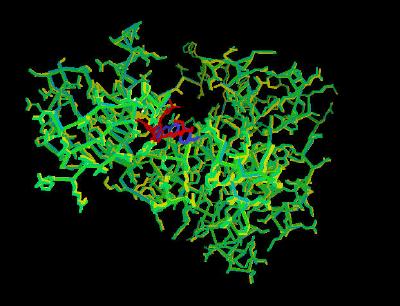
An overlay of unbound and both inhibitor-bound chains is shown in Kinemage 3.
The Kinemages
The real-time visualization using KiNG of the structures on this site requires a java-enabled (JRE from Java) browser.
Possible Icons to the left of molecular model image on the download page
| Java Not Activated | Java Not Activated | Java Functional |
|
Blank Area
or message: Image requires a Java enabled browser
|
|
| KiNG Inactive | KiNG Inactive | KiNG Full Functional |
A single click on the KiNG logo will launch the appropriate kinemage.
Kinemage 1: Dimer structures for inhibitor bound and unbound tyrosine kinase domain of FGFR 1
|
102 K |
 |
| Click On KiNG to see |
Crystal Structure Dimers |
Kinemage 2: Comparison of the inhibitor bound monomer (Chain A) to the unbound tyrosine kinase domain of FGFR 1
View 1 overlay of the three structures
View 2 arbitrary top view
View 3 arbitrary front view of the inhibitory binding cleft
View 4 bottom of the inhibitor binding cleft
|
1,072 K |
 |
| Click On KiNG to see |
Monomer Showing Inhibitor Binding |
Kinemage 3: Overlay of the Unbound and Both Inhibitor-Bound Tyrosine Kinase Chains
View 1 overlay of the three structures
View 2 arbitrary top view
View 3 arbitrary front view of the inhibitory binding cleft
View 4 bottom of the inhibitor binding cleft
View 5 bound and unbound position of Lys-514
|
1,055 K |
 |
| Click On KiNG to see |
Three Structure Overlay |
Sequence: (X-ray resolved residues are 465-762 of the human FGFR 1)
Unresolved N-Terminal: MVAGVSEYE
X-Ray Resolved: LPEDPRWELPRDRLVLGKPLGEGAFGQVVLAEAIGLDKDKP
NRVTKVAVKMLKSDATEKDLSDLISEMEMMKMIGKHKNIINLLGACTQDGPLYVIVE
YASKGNLREYLQARRPPGLEYSYNPSHNPEEQLSSKDLVSCAYQVARGMEYLASKK
CIHRDLAARNVLVTEDNVMKIADFGLARDIHHIDYYKKTTNGRLPVKWMAPEALFDR
IYTHQSDVWSFGVLLWEIFTLGGSPYPGVPVEELFKLLKEGHRMDKPSNCTNELYMM
MRDCWHAVPSQRPTFKQLVEDLDRIVALTS
Unresolved C-Terminal: NQE
Source:
Human sequence expressed in spodoptera frugiperda insect cell line sf9; Structural coordinates were taken from the Brookhaven Database file 2FGI.
Structural Coordinates from the Brookhaven Database files1AGM, 1FGK, and 2FGI.
My University Home Harris Links Chemistry / Modeling Links
FGF Site: FGF Intro Nomenclature Notes References FGF Sequences FGFR Sequences
Copyright 2005-2020 by Larry P. Taylor
Molecular &
Behavioral Neuroscience Institute
University of Michigan
All Rights Reserved
Supported by the Pritzker Neuropsychiatric Disorders Research Consortium, and by NIH Grant 5 P01 MH42251, Conte Center Grant #L99MH60398, RO1 DA13386 and the Office of Naval Research (ONR) N00014-02-1-0879 to Huda Akil & Stanley J. Watson. at the Molecular & Behavioral Neuroscience Institute.