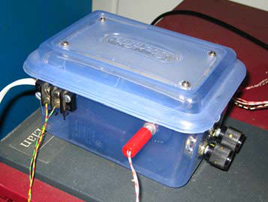
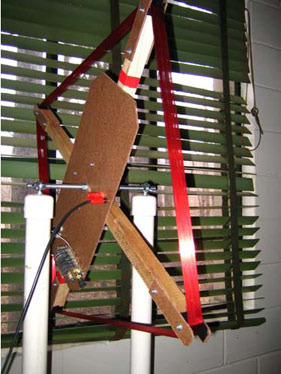
A few of us at McMath-Hulbert Solar Observatory (you remember, that old place where you guys stole the McMath scope from?) recently got involved with monitoring US Naval submarine communications VLF stations in order to track SID’s (Sudden Ionospheric Disturbances). We did this with homemade “Gyrator” radios and homemade loop antennas. The Gyrators are inexpensive, very simple, easy to build, VLF receivers the designs for which can be found online (“Gyrator II” and “Gyrator III”). FAR Circuits has boards for them and the parts are easily obtainable. The loop antennas are roughly 20” square with about 140 turns of #30 wire and they are tuned with 365 pf tuning condensers like you would find in an old AM radio. The output of these Gyrators is fed through an analog to digital converter and into the serial port of a computer. Below are photos of our versions of the Gyrator II on the left and Gyrator III on the right. The loop antenna is shown below that.
| |
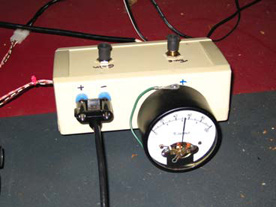
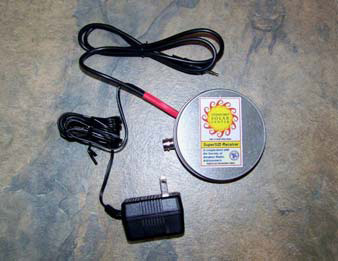
Lately we have become involved with a project called SuperSID which is run by Stanford University and SARA (Society of Amateur Radio Astronomers). They provide a “receiver” (actually a low-noise pre-amp) to be used with a 96 KHz soundcard and special software that monitors VLF frequencies, records data once every 5 seconds, 24 hours/day, then automatically sends the files to Stanford at the close of the day. The beauty of the SuperSID soundcard setup is that several stations can be monitored at once, rather than just one as with the Gyrators (or any other true radio receiver). The SuperSID Project has several of these “receivers” all around the globe, each with their own ID and each submitting daily data to Stanford. These reside at high schools, universities, public institutions, and even some individuals’ homes. Below is a photo of the SuperSID hardware which looks sort of like a can of breath mints.
At McMath-Hulbert we are currently monitoring the following stations:
NAA, 24.0 KHz in Maine.
NAU, 40.75 KHz in Puerto Rico.
NML, 25.2 KHz in North Dakota.
NLK, 24.8 KHz in Washington state.
NPM, 21.4 KHz in Hawaii.
NWC, 19.8 KHz in Australia.
Two stations in France and one in Japan.
And open frequencies at 20, 22.65 and 27 KHz in order to track the noise floor.
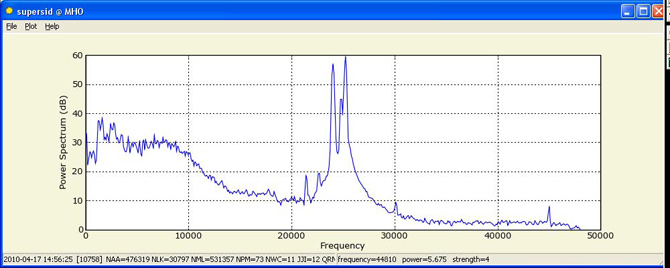
Below is a screenshot of one sample from the SuperSID software. The spikes at 22.65, 30 and just above 45 KHz are not stations and are associated with unknown noise sources. This particular sample prominently shows NAA, NML, NLK and NPM which are the most reliable day-to-day stations received from this area.
The signals are stronger during the night but our interest is daytime since the solar disturbances affect the daytime ionosphere. Samples of the signal strength of the stations are taken every 5 seconds, recorded by the software and saved into an Excel .csv file where it can be later analyzed and plotted. So the resultant daily file has 17280 rows of data for each frequency monitored. There is no interest in the content of the transmission—it is data, encrypted FSK at 200 baud. NAA is said to be the most powerful VLF transmitter in the world at 1800 KW. There is an interesting Wiki article on NAA which shows its elaborate antenna system and its history—http://en.wikipedia.org/wiki/VLF_Transmitter_Cutler
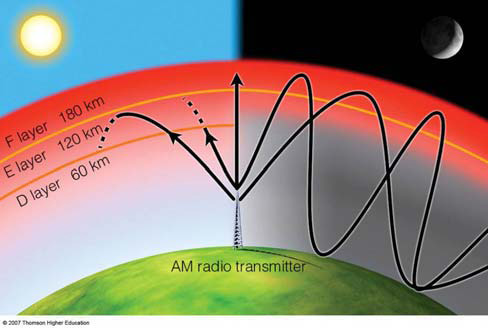
The nighttime ionosphere basically consists of the F layer which is about 180 kilometers high. Signals reflect off the F layer and bounce back to Earth. During the day when the sun energizes things, the ionosphere becomes comprised of, roughly, 3 layers—the F (highest), E (middle) and D the lowest at about 60 kilometers. Normally during a quiet solar day, the VLF signals go through the D layer to the higher mid-level E layer, then lose energy as they reflect and pass back through the lower D layer on their way back to earth. SIDs are caused by solar activity abruptly increasing the ionization of all layers of the ionosphere. The normally less active, and lower, D layer of the ionosphere is energized to the point that it briefly becomes the daytime bounce point for VLF signals rather than the E layer. Signals bounce cleanly off the D layer during the SID, briefly increasing the received signal strength on the monitor. See the illustration below which shows quiet day behavior.
The resultant daily plots can be analyzed for spikes during the daytime for this solar activity and then compared to the GOES (Geostationary Operational Environmental Satellite) data—http://www.swpc.noaa.gov/rt_plots/xray_5m.html . In the example below recorded from station NAA, which is plotted on GMT or UTC, the spike between 16:00 and 17:00 shows a SID. The portion between about 02:00 and 09:00 is the nighttime “signature” which is generally quite sporadic in appearance and generally stronger than the daytime signal. Between 03:00 and 04:00 is an apparent daily maintenance shutoff done at NAA. Between about 08:30 and 10:00 is the daily sunrise signature apparent on most station signals.
One hazard in monitoring these stations is that their prime reason for existence is to provide encrypted submarine communications, so power levels, maintenance downtime, etc., are totally under the Navy’s control and are not published. Hence some apparent anomalies are due to the station parameters, not solar disturbances. Fortunately, the shape of a SID is quite repeatable and recognizable despite station issues.
Above is a closeup of the SID on May 4, 2010. The rise and recovery rates are typical for a SID signature.
Above is the 3 day GOES Xray Flux chart that is available online. Note the spike on May 4 that corresponds to the spike on our SuperSID chart.
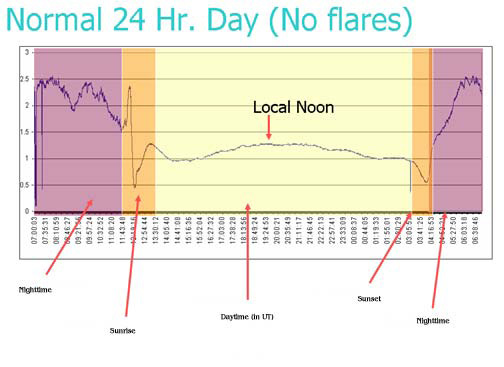
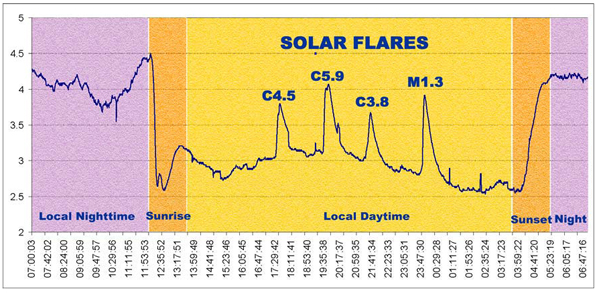
Below are two simulated plots that show a 24 hour day with no flares and another day with 4 flares.
Believe it or not, this indirect method of observation qualifies as radio astronomy and the data are used by solar researchers which we can only hope will be shared with us in the future. You may visit www.mcmathhulbert.org for some more photos. See also the McMath-Hulbert Observatory facebook page (http://www.facebook.com/MHObservatory) and the McMath-Hulbert Observatory blog (http://mho.5thelement.com/).
“Seldom Seen” Dave Benham, McMath-Hulbert die-hard