Chapter 10: Catalysis and Catalytic Reactors


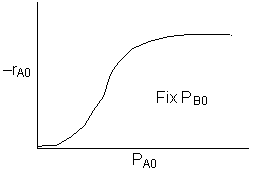
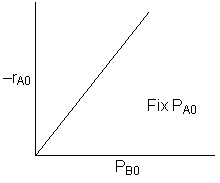
Plot (d)

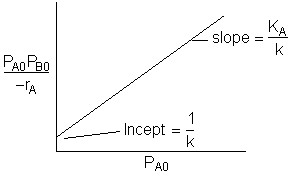
D) \( -r_A = \frac{k P_A P_B}{1 + K_A P_A + K_C P_C} \) \( -r_{A0} = \frac{k P_{A0} P_{B0}}{1 + K_A P_{A0}} \)
A graph showing the initial reaction rate -r_A0 on the y-axis versus the partial pressure of species A (P_A0) on the x-axis. The curve shows a sigmoidal increase, starting slow, rising steeply, and then leveling off. The text 'Fix P_B0' indicates that the partial pressure of species B is held constant during the experiment. A graph showing the initial reaction rate -r_A0 on the y-axis versus the partial pressure of species B (P_B0) on the x-axis. The plot is a straight line with a positive slope, indicating a direct linear relationship. The text 'Fix P_A0' suggests that the partial pressure of species A is held constant during the experiment.
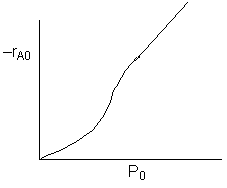
A graph showing the initial reaction rate -r_A0 on the y-axis versus total pressure P_0 on the x-axis. The curve starts at the origin, increases nonlinearly, and transitions into a linear region at higher pressures. A small dot marks the transition point where the curve changes from nonlinear to linear. A graph showing P_A0 times P_B0 divided by -r_A on the y-axis, and P_A0 on the x-axis. The plot is a straight line with a positive slope labeled as K_A divided by k. The y-intercept is labeled as 1 divided by k, though it is misspelled as 'Incept' instead of 'Intercept'.

Back to Chapter 10