Chapter 10: Catalysis and Catalytic Reactors


Plot (c)

C)

\( -r_A = \frac{k P_A P_B}{\left(1 + K_A P_A + K_B P_B + K_C P_C\right)^2} \)

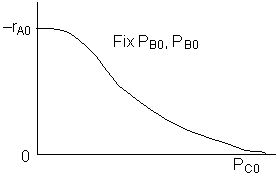
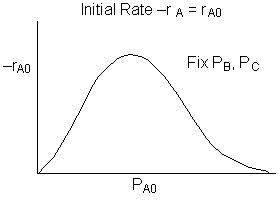
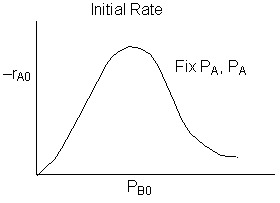
\( -r_{A0} = \frac{k P_{A0} P_{B0}}{\left(1 + K_A P_{A0} + K_B P_{B0} + K_C P_{C0}\right)^2} \)

A graph with -r_A0 on the y-axis and P_C0 on the x-axis. The curve starts at a high reaction rate and decreases steadily as P_C0 increases, approaching zero. The graph includes a label 'Fix P_B0, P_B0', indicating that other partial pressures are held constant during this analysis. A graph showing the relationship between the initial rate of reaction -r_A0 (equal to r_A0) on the y-axis and the partial pressure of species A (P_A0) on the x-axis. The curve forms a bell shape, increasing to a maximum and then decreasing. The text 'Fix P_B, P_C' indicates that the partial pressures of species B and C are held constant during the experiment.
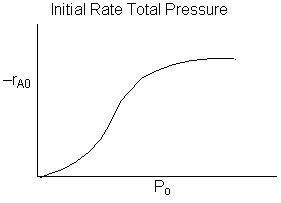
A graph showing the initial reaction rate -r_A0 on the y-axis and the partial pressure of species B (P_B0) on the x-axis. The curve increases to a peak and then declines, forming a bell shape. The text 'Fix P_A, P_A' indicates that the partial pressure of species A is held constant during the experiment, though the repeated subscript may be a typo. A graph titled 'Initial Rate Total Pressure' showing -r_A0 on the y-axis and total pressure P_0 on the x-axis. The curve rises steeply at first, then gradually levels off, indicating that the initial reaction rate increases with total pressure before reaching a plateau.

\( -r_{A0} = \frac{k y_{A0} P_0 y_{B0} P_0}{\left[1 + \left(K_A y_{A0} + K_B y_{B0} + K_C y_{C0} \right) \right]^2} \)

\( -r_{A0} = \frac{k_1 P_0^2}{\left[1 + \left(K_2 P_0 \right)\right]^2} \)

\( \text{low } P_0 \quad \Rightarrow \quad -r_{A0} \sim P_0^2 \)

\( \text{high } P_0 \quad \Rightarrow \quad -r_{A0} \sim \frac{P_0^2}{P_0^2} = \text{constant} \)

Back to Chapter 10