Chapter 10: Catalysis and Catalytic Reactors


Plot (b)

B)

\( -r_A = \frac{k P_A}{\left(1 + K_A P_A + K_B P_B\right)^2} \)

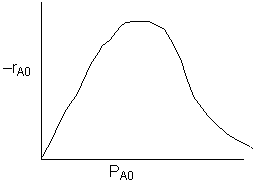
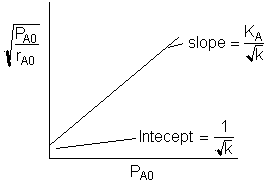
\( -r_{A0} = \frac{k P_{A0}}{\left(1 + K_A P_{A0}\right)^2} \)

A graph showing the reaction rate -r_A0 on the y-axis versus the initial partial pressure P_A0 on the x-axis. The curve rises initially, reaches a peak, and then decreases, forming a bell-shaped curve. This indicates an optimal pressure range for maximum reaction rate before it declines at higher pressures. A plot with the y-axis labeled as the square root of P_A0 divided by r_A0, and the x-axis labeled as P_A0. The graph shows a straight line with a positive slope. The slope is labeled as K_A divided by the square root of k, and the y-intercept is labeled as 1 divided by the square root of k. The word 'Intercept' is misspelled as 'Intecept' in the image.

Back to Chapter 10