Chapter 10: Catalysis and Catalytic Reactors


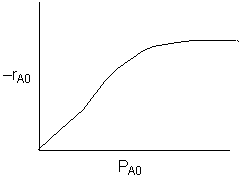
Plot (a)

A)

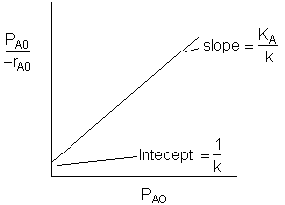
\( -r_A = \frac{k P_A}{1 + K_A P_A + K_B P_B}, \quad -r_{A0} = \frac{k P_{A0}}{1 + K_A P_{A0}} \)

A graph showing the relationship between the initial partial pressure of species A (P_A0) on the x-axis and the reaction rate -r_A0 on the y-axis. The curve starts at the origin, increases rapidly, and then gradually levels off, indicating a saturation behavior as P_A0 increases. A plot with the y-axis labeled as P_A0 divided by -r_A0 and the x-axis labeled as P_A0. The graph shows a straight line with a positive slope. The slope is annotated as K_A divided by k, and the y-intercept is labeled as 1 divided by k.

Back to Chapter 10