Chapter 10: Catalysis and Catalytic Reactors


Dimethyl Ether

Self Test 1

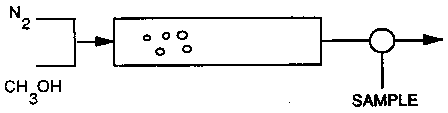
A process flow diagram showing nitrogen gas (N₂) and methanol (CH₃OH) being fed into a mixing or reaction chamber. The chamber contains particles or catalyst beds, represented by circles. The output flows through a sampling port labeled 'SAMPLE' before continuing out of the system.

\( \mathrm{2CH_3OH \longrightarrow CH_3{-}O{-}CH_3 + H_2O} \)

\( \mathrm{2ME \longrightarrow DME + W} \)

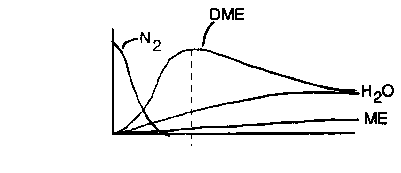
A multi-line graph showing the concentration profiles of different chemical species over time or distance. The curves represent N₂, DME, H₂O, and ME. N₂ decreases sharply, while DME rises to a peak and then declines. H₂O gradually increases and then levels off, and ME shows a slight upward trend. A vertical dashed line marks the peak of the DME curve.

1) Why doesn't water initially exit the reactor the same as DME?  Which of the following best describes the data?

  1. There is more DME than water.

  2. Steady state has been reached.

  3. Water reacts with ME.

  4. Water is adsorbed on the surface.

  5. Two of the above are true.

Solution

Self Test 2 - Dimethyl Either

A process flow diagram showing nitrogen gas (N₂) and methanol (CH₃OH) being fed into a mixing or reaction chamber. The chamber contains particles or catalyst beds, represented by circles. The output flows through a sampling port labeled 'SAMPLE' before continuing out of the system.

\( \mathrm{2CH_3OH \longrightarrow CH_3{-}O{-}CH_3 + H_2O} \)

\( \mathrm{2ME \longrightarrow DME + W} \)

A multi-line graph showing the concentration profiles of different chemical species over time or distance. The curves represent N₂, DME, H₂O, and ME. N₂ decreases sharply, while DME rises to a peak and then declines. H₂O gradually increases and then levels off, and ME shows a slight upward trend. A vertical dashed line marks the peak of the DME curve.

  2) Which of the following are true?

 The concentration of DME reaches a maximum because

  1. it just does.

  2. the rate of reaction is very rapid initially.

  3. all the sites are vacant initially so that (Methanol) ME is rapidly adsorbed.

  4. there is very little water initially adsorbed on the surface.

  5. DME is probably not on the surface.

  6. All of the above.

Solution
Self Test 3    Dimethyl Either

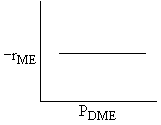
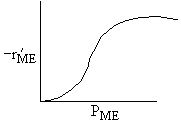
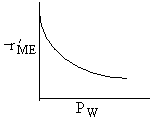
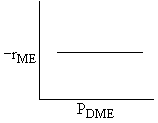
If the rate law is \( -r'_{\text{ME}} = \frac{k P_{\text{ME}}^2}{\left[1 + K_{\text{ME}} P_{\text{ME}} + K_{\text{W}} P_{\text{W}}\right]^2} \)

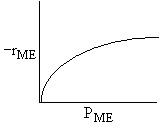
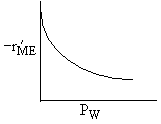
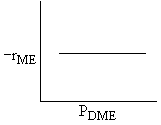
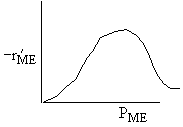
Which set of figures describes the rate the functionality of the partial pressure of this rate law.

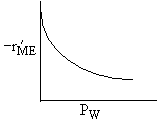
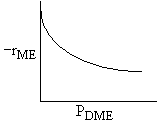
A A graph showing -r'_ME on the y-axis and P_W on the x-axis. The curve demonstrates an inverse relationship, starting at a high reaction rate and decreasing asymptotically as water partial pressure (P_W) increases. A graph showing -r_ME on the y-axis and P_DME on the x-axis. The curve starts at a high value and decreases asymptotically, indicating that the reaction rate decreases as the partial pressure of dimethyl ether (P_DME) increases. A graph showing -r_ME on the y-axis and P_ME on the x-axis. The curve rises quickly at low P_ME values and then levels off, indicating a saturation behavior where the reaction rate increases with partial pressure of ME but approaches a maximum limit.
B Graph showing -r'_ME on the y-axis and P_W on the x-axis. The curve exhibits an inverse relationship, with the reaction rate decreasing sharply at first and then gradually leveling off as the partial pressure of water (P_W) increases. A graph with -r_ME on the y-axis and P_DME on the x-axis. The plot shows a horizontal line, indicating that the reaction rate remains constant regardless of the partial pressure of dimethyl ether (P_DME). A graph showing -r'_ME on the y-axis and P_ME on the x-axis. The curve rises sharply, reaches a peak, and then declines, forming a bell-shaped profile. This suggests that the reaction rate first increases with the partial pressure of ME, then decreases after reaching an optimal point.
C A graph showing -r'_ME on the y-axis and P_W on the x-axis. The curve exhibits a downward trend, starting at a high reaction rate and gradually decreasing as the partial pressure of water (P_W) increases, indicating an inverse relationship. A graph showing -r_ME on the y-axis and P_DME on the x-axis. The plot is a horizontal line, indicating that the reaction rate remains constant and is unaffected by changes in the partial pressure of dimethyl ether (P_DME). A graph showing -r'_ME on the y-axis and P_ME on the x-axis. The plot is a straight line with a positive slope, indicating a linear relationship where the reaction rate increases proportionally with the partial pressure of ME.
D A graph showing -r'_ME on the y-axis and P_W on the x-axis. The curve starts at a high value and decreases sharply before gradually leveling off, indicating an inverse relationship between the reaction rate and the partial pressure of water (P_W). A graph showing -r_ME on the y-axis and P_DME on the x-axis. The plot is a horizontal line, indicating that the reaction rate remains constant and is independent of the partial pressure of dimethyl ether (P_DME). A graph showing -r'_ME on the y-axis and P_ME on the x-axis. The curve increases sharply at first, then begins to level off, showing a saturation behavior where the reaction rate increases with partial pressure of ME (P_ME) and approaches a maximum.

Solution

Solution #1

  No ME exits the reactor so it is either being consumed to form DME or being adsorbed on the surface or both.

One mole of DME and one mole of water are formed for every two moles of ME consumed. DME exits the reactor while water does not, consequently it must be adsorbed on the surface.

We note when we reach steady state after a period of time, the exit concentration of DME and water are the same. Steady state has indeed been reached because the concentrations of W and DME are equal and the concentrations are no longer changed with time.

Ans: E

Back to Problem 1  

Back to Chapter 13

Solution

F       All of the above.

For every DME formed one water is formed. DME initially comes out the end of the reactor, while water does not. If DME were on the surface it would take up sites and would not exit for a while. The concentration of DME reaches a maximum because it initially has so many sites on which to react. After a while the water occupies a number of the sites so that there are fewer for ME to adsorb upon and react.

Back to Problem 2

Back to Chapter 13

Solution 3

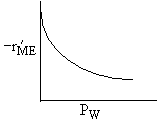
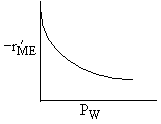
W :

\(-r'_{\text{ME}} \sim \frac{k}{(1 + \ldots + K_{\text{W}} P_{\text{W}})^2} \sim \frac{1}{P_{\text{W}}^2}\)

A graph showing -r'_ME on the y-axis and P_W on the x-axis. The curve starts high and decreases gradually, indicating an inverse relationship where the reaction rate declines as the partial pressure of water (P_W) increases.
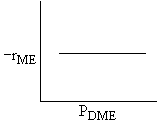
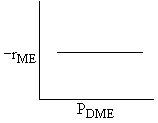
DME:

\(-r'_{\text{ME}} \ne f(P_{\text{DME}})\)

A graph showing -r_ME on the y-axis and P_DME on the x-axis. The curve is a horizontal line, indicating that the reaction rate remains constant regardless of changes in the partial pressure of dimethyl ether (P_DME).
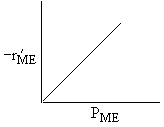
ME :

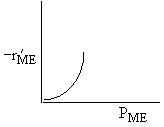
\(-r'_{\text{ME}} \sim \frac{P_{\text{ME}}^2}{(1 + K_{\text{ME}} P_{\text{ME}} + \ldots)^2}\)

Low \(P_{\text{ME}}\), \(1 \gg K_{\text{ME}} P_{\text{E}}\) ⟹ \(-r'_{\text{ME}} \sim P_{\text{ME}}^2\)

A graph showing -r'_ME on the y-axis and P_ME on the x-axis. The curve starts near zero and increases sharply, indicating that the reaction rate rises rapidly with increasing partial pressure of ME (P_ME), suggesting a nonlinear relationship.

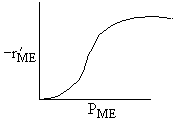
High \(P_{\text{ME}}\), \(K_{\text{ME}} P_{\text{E}} \gg 1\) ⟹ \(-r'_{\text{ME}} \sim \frac{k P_{\text{ME}}^2}{P_{\text{ME}}^2} \sim k\)

A graph showing -r_ME on the y-axis and P_DME on the x-axis. The plot is a horizontal line, indicating that the reaction rate does not change with varying partial pressure of dimethyl ether (P_DME).
Combining
A graph showing -r'_ME on the y-axis and P_ME on the x-axis. The curve rises steeply at first and then gradually levels off, indicating a saturation-type behavior where the reaction rate increases with P_ME before approaching a maximum limit.
Answer D

Back to Problem 3

Back to Chapter 10