Chapter 9: Reaction Mechanisms, Pathways, Bioreactions and Bioreactors
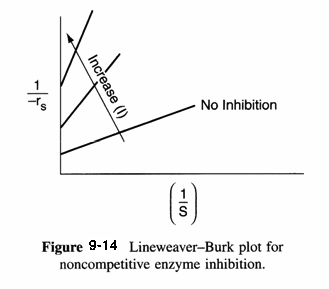
Sketch Non-Competitive Inhibition on a Lineweaver-Burk Plot
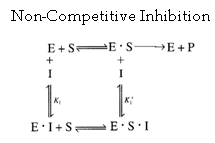
\( -r_S = \frac{V_{\max} (S)}{(S) + K_M \left( 1 + \frac{(I)}{K_I} \right) } \)
\( \frac{1}{-r_S} = \frac{(S) + K_M \left( 1 + \frac{(I)}{K_I} \right)}{V_{\max} (S)} \)
\( \frac{1}{-r_S} = \frac{(S) \left( 1 + \frac{(I)}{K_I} \right) + K_M \left( 1 + \frac{(I)}{K_I} \right)}{V_{\max} (S)} \)
\( \frac{1}{-r_S} = \frac{1}{V_{\max}} \left( 1 + \frac{(I)}{K_I} \right) + \frac{K_M}{V_{\max}} \left( 1 + \frac{(I)}{K_I} \right) \frac{1}{(S)} \)
Both slope and intercept change as inhibitor concentration is increased