Chapter 8: Multiple Reactions
Multiple Reactions
\( A + 2B \xrightarrow{k_{1A}} C \)
\( 3C + 2A \xrightarrow{k_{2C}} D \)
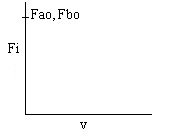
Before carrying out any calculations, make a sketch as to what you
expect the molar flow rate profiles to look like
\( A + 2B \xrightarrow{k_{1A}} C \)
\( 3C + 2A \xrightarrow{k_{2C}} D \)
Before carrying out any calculations, make a sketch as to what you
expect the molar flow rate profiles to look like
Solution
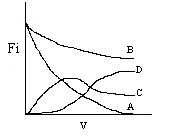
A is consumed in reactions 1 and 2, so Fa will steadily decrease
B is consumed in reaction 1, and
once A is consumed, it will no longer be able to react and the flow rate will remain constant
C
is produced in reaction 1, consumed in reaction 2, and therefore the molar flow rate will go through a
maximum will also no longer be consumed once A is used up
D will be produced once C is formed and
will continue to increase until A is consumed
You may want to solve for these profiles quantatatively by using Polymath