Chapter 8: Multiple Reactions
Concentration-Time Trajectories
1. The following concentration-time trajectories were observed in a batch reactor
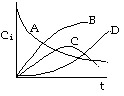
Which of the following
reaction pathways best describes the data:
a) \( A \rightarrow B \rightarrow C \rightarrow D \)
b) \( A \rightarrow B \)
\( A \rightarrow C \rightarrow D \)
c) \( A \rightarrow B \rightarrow C \rightarrow D \)
\( A \rightarrow D \)
2. Sketch the concentration-time trajectory for the reaction:
1) \( A + B \rightarrow C \)
2) \( B + C \rightarrow D \)
\( C_{A0} = 4 \ \text{mol/dm}^3 , \quad C_{B0} = 6 \ \text{mol/dm}^3 , \quad C_{C0} = C_{D0} = 0 \)
Solution: Part 1
Choice B is the answer. Choices A and C are incorrect because they show species B
eventually consumed, which is clearly not the case.
(1) B virtually consumed so no more D can be produced in reaction 2.
(2) Rates of Consumption of A and Ba are virtually the same.
(3) Rate of consumption of B greater than that of A owing to Reaction 2.
Below is the polymath code typed in to produce the graph above.