Chapter 8: Multiple Reactions
Finding the Selectivity
For the elementary reactions:
\( A \xrightarrow{k_1} B \xrightarrow{k_2} C \)
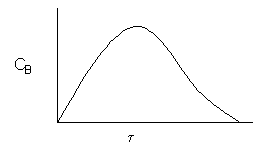
with k1=.1 s-1 and k2=.2 s-1 with CAO= 2 mol/dm3. Plot the concentration of B and selectivity of B to C as a function of space time in a CSTR.|
|
For the elementary reactions:
\( A \xrightarrow{k_1} B \xrightarrow{k_2} C \)
with k1=.1 s-1 and k2=.2 s-1 with CAO= 2 mol/dm3. Plot the concentration of B and selectivity of B to C as a function of space time in a CSTR.Solution
\(\tilde{S}_{BC} = \frac{F_B}{F_C} = \frac{v_0 C_B}{v_0 C_C} = \frac{C_B}{C_C} \)
CSTR A. Balance on Species A\( V = \frac{F_{A0} - F_A}{-r_A} = \frac{v_0 \left[ C_{A0} - C_A \right]}{k_1 C_A} \)
\( \tau = \frac{C_{A0} - C_A}{k_1 C_A} \)
\( \boxed{ C_A = \frac{C_{A0}}{1 + \tau k_1} } \)
B.Balance on Species B
\( V = \frac{0 - F_B}{-r_B} = \frac{F_B}{r_B} \)
\( V = \frac{v_0 C_B}{k_1 C_A - k_2 C_B} \)
\( \boxed{ C_B = \frac{\tau k_1 C_A}{1 + \tau k_2} = \frac{\tau k_1 C_{A0}}{(1 + \tau k_1)(1 + \tau k_2)} } \)

C.Balance on Species C
\( V = \frac{0 - C_C v_0}{-r_C} = \)
\( \tau = \frac{V}{V_0} \) \( r_C = k_2 C_B \) \( \tau = \frac{C_C}{k_2 C_B} \)
\( \boxed{ C_C = k_2 \tau C_B } \)
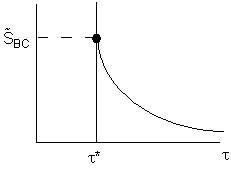
\( \boxed{ \tilde{S}_{BC} = \frac{C_B}{k_2 \tau C_B} = \frac{1}{k_2 \tau} } \)

The space time, \( \tau^* \), is the minimum value of V (i.e.\( \tau^* \)) at which there is an acceptable molar flow rate of the desired product B from the CSTR.
\( F_B = v_0 C_B = \frac{\tau^* k_1 F_{A0}}{(1 + k_1 \tau^*)(1 + k_2 \tau^*)} \)