Chapter 8: Multiple Reactions
What Type of Reaction is Taking Place?
Three species were found in a CSTR. The following concentration data were
obtained as a function of temperature. The initial concentration of the single
reactant, A, was the same at all temperatures. Both B and C are products.
CA0 =
2moles/dm3
|
Run
|
T (oC)
|
CA (mole/dm3)
|
CB (mole/dm3)
|
CC (mole/dm3)
|
|
1
|
30
|
1.7
|
0.01
|
0.29
|
|
2
|
50
|
1.4
|
0.03 |
0.57
|
|
3
|
70
|
1.0
|
0.1
|
0.90
|
|
4
|
100
|
0.5
|
1.25
|
1.25
|
|
5
|
120
|
0.1
|
1.80
|
0.1
|
|
6
|
130
|
0.01
|
1.98
|
0.01
|
Explain the above data, what type of reaction is taking place, independent,
complex, series or parallel ?
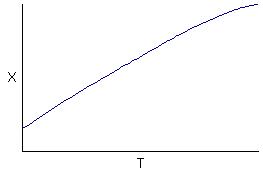
Hint 1: What are the trends?
Hint 2: What do the trends suggest?
Hint 1
Observations
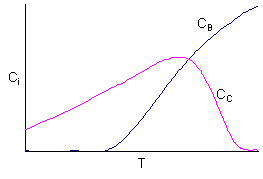
At low temperatures
1) Little conversion of A
2) Little B formed
3) Mostly C formed (but not too much because of the low conversion - 15 to 30% - of A)
At high temperatures
1) Virtually complete conversion of A
2) Mostly B formed
Hint 2
Data suggest 2 reactions
(1) \( A \xrightarrow{k_1} B \) \(-r_{1A} = k_1 C_A = C_A A_1 e^{-E_1 / RT} = r_B \)
(2) \( A \xrightarrow{k_2} C \) \(-r_{2A} = k_2 C_A = C_A A_2 e^{-E_2 / RT} = r_C \)
Solution
Observations
At low temperatures
1) Little conversion of A
2) Little B formed
3) Mostly C formed (but not too much because of the low conversion - 15 to 30% - of A)
At high temperatures
1) Virtually complete conversion of A
2) Mostly B formed


Data suggest 2 reactions
(1) \( A \xrightarrow{k_1} B \) \(-r_{1A} = k_1 C_A = C_A A_1 e^{-E_1 / RT} = r_B \)
(2) \( A \xrightarrow{k_2} C \) \(-r_{2A} = k_2 C_A = C_A A_2 e^{-E_2 / RT} = r_C \)
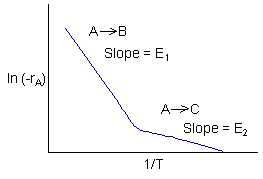
Reaction (1) is dominant at high temperatures
\( k_1 = A_1 e^{-E_1 / RT} \)
with
\( k_2 \gg k_1 \) \( A_2 \gg A_1 \)
Reaction (2) is dominant at low temperatures
\( k_1 \gg k_2 \) \( E_1 > E_2 \)
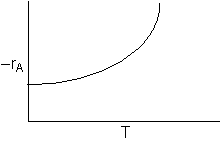
\(-r_A = \left( k_1 + k_2 \right) C_A = \left( A_1 e^{-E_1 / RT} + A_2 e^{-E_2 / RT} \right) C_A \)

