Chapter 7: Collection and Analysis of Rate Data
What Two Things are Wrong with This Solution?
Problem
The reaction
\( A \rightarrow B \)
is carried out in a constant volume batch reactor. Determine the reaction order and specific reaction rate from the following data.
| t (min) | 0 | 10 | 20 | 30 |
| CA(mol/dm3) | 1 | 0.6 | 0.4 | 0.3 |
Solution
\( -r_A = k C_A^\alpha = - \frac{dC_A}{dt} \)
| t | CA | \( -\Delta C_A \) | \( -\frac{\Delta C_A}{\Delta t} \) | \( -\frac{dC_A}{dt} \) |
| 0 | 1 | |||
| 0.4 | -(0.6-1.0)/(10-0)=0.04 | |||
| 10 | 0.6 | |||
| 0.2 | -(0.4-0.6)/(20-10)=0.02 | |||
| 20 | 0.4 | |||
| 0.1 | -(0.2-0.4)/(30-20)=0.01 | |||
| 30 | 0.3 |
First find \(\left[ \frac{dC_A}{dt} \right]\)
| t | CA | \( -\frac{\Delta C_A}{\Delta t} \) | \( -\frac{dC_A}{dt} \) |
| 0 | 1 | 0.05 | |
| 0.04 | |||
| 10 | 0.6 | 0.03 | |
| 0.02 | |||
| 20 | 0.4 | 0.015 | |
| 0.01 | |||
| 30 | 0.3 | 0.005 |
Now plot \( -\frac{dC_A}{dt} \) versus t and it should be a straight line.
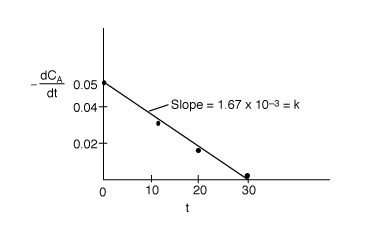
The plot is essentially linear, therefore the reaction is zero order. From the slope of the line we
find
k=0.00167 mol/dm3 min.
What two things are wrong with this solution?
1) The graphical differentiation of the data is incorrect as \( -\frac{\Delta C_A}{\Delta t} \) is plotted as function of \( \Delta C_A \). First, even the data of \( -\frac{\Delta C_A}{\Delta t} \) versus \( - \Delta C_A \) is not plotted correctly. According to this incorrect analysis, it should rise linearly. However, this fact is irrelevant because the x-axis should be time, not \( \Delta C_A \). The correct plot is as follows.
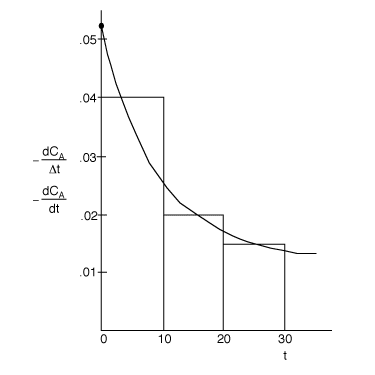
| t | CA | \( -\frac{dC_A}{dt} \) |
| 0 | 1 | 0.053 |
| 10 | 0.6 | 0.028 |
| 20 | 0.4 | 0.017 |
| 30 | 0.3 | 0.014 |
2) The plot to determine the reaction order and reate constant is incorrect. Combined mole balance and postulated rate law is
\( -\frac{dC_A}{dt} = k C_A^\alpha \)
taking the natural log of both sides
\( \ln \left( - \frac{dC_A}{dt} \right) = \ln k + \alpha \ln C_A \)
Plot \( \ln \left( - \frac{dC_A}{dt} \right) \) versus ln CA or plot \( -\frac{dC_A}{dt} \) versus CA on log-log paper to determine the reaction order. The correct plot on log-log is as follows.
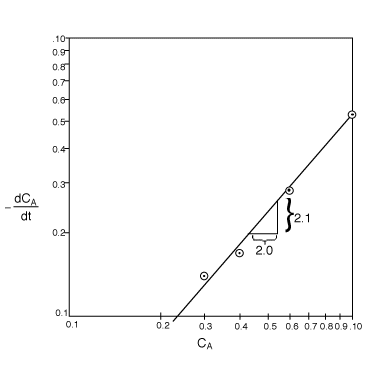
The reaction order is
\( \alpha = \frac{2.1}{2.0} = 1.0 \)
therefore,
\( -r_A = k C_A \)
\( -r_A = - \frac{dC_A}{dt} \)
\( k = \frac{- \frac{dC_A}{dt}}{C_A} \)
When CA=1.0 mol/dm3 then
\( - \frac{d(C_A)}{dt} = 0.053 \, \frac{\text{mol}}{\text{dm}^3 \, \text{min}} \)
\( k = \frac{0.053 \, \frac{\text{mol}}{\text{dm}^3 \, \text{min}}}{1.0 \, \frac{\text{mol}}{\text{dm}^3}} \)
\( k = 0.053 \, \text{min}^{-1} \)