Chapter 7: Collection and Analysis of Rate Data


Polymath Regression Analysis Tutorial

First, launch Polymath, either from the CD included with previous editions of the course textbook, or from your hard drive if you have previously installed Polymath. You will now see a window that looks like this:

Screenshot of the POLYMATH 6.10 Educational Release window, showing the menu bar with options for File, Program, Window, and Help. Several icons are visible for functions like opening files, saving, cutting, copying, and accessing mathematical functions.


To perform regression calculations click on the Regression (Icon representing a table or grid with colorful cells, likely used for matrix or array functions in the POLYMATH software.) button in the toolbar. You will see a table that looks like this:
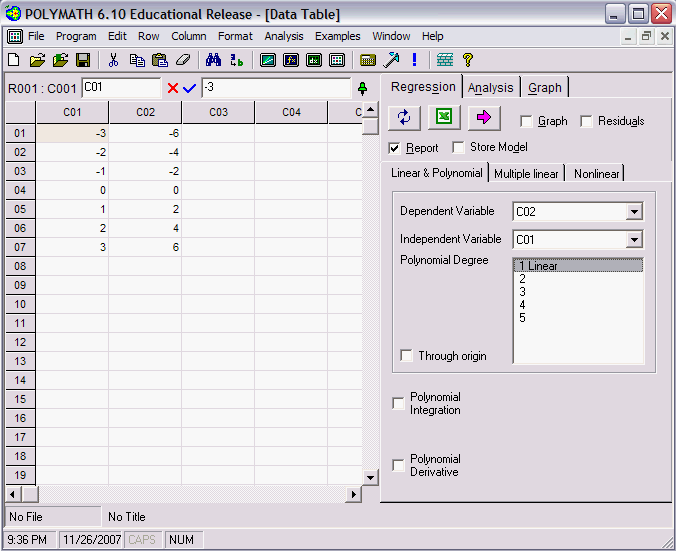
Screenshot of POLYMATH 6.10 Educational Release window showing a data table with values in columns labeled C01 to C04. The regression settings on the right allow selection of dependent and independent variables (C02 and C01, respectively) and polynomial degree. The options include linear, polynomial integration, and polynomial derivative.

You can either type your data directly into this table, or copy it in from another spreadsheet.

In the regression screen you can select the type of regression that Polymath will perform. You can select the output of the regression with a graph, residuals and report. Clicking the pink Solve button causes the regression to be carried out.
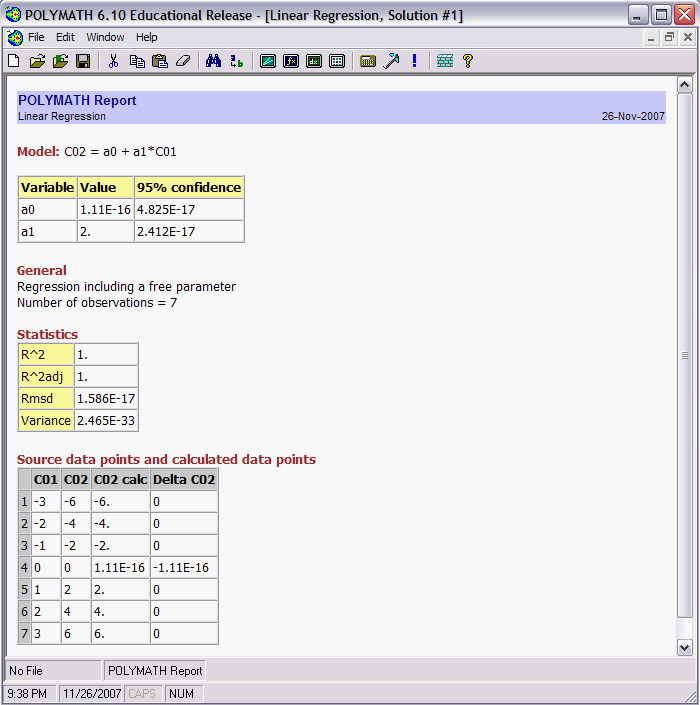

Screenshot of the POLYMATH 6.10 Educational Release window displaying a Linear Regression report. The model shows C02 = a0 + a1*C01 with calculated values for a0 and a1, along with 95% confidence intervals. The statistics include R², R²adj, RMSd, and Variance. The source data points and calculated data points are listed with columns for C01, C02, calculated C02, and the delta of C02.

This is a report of the regression data. It includes the model, the values of the model parameters, the statistical confidence of the parameters, and several other staistics. Sometimes when the model should have values of 0 they show up as very small numbers, as is the case here for "a0".


The regression calculator can also do other regressions, like quadratics and even very complicated non-linear equations.
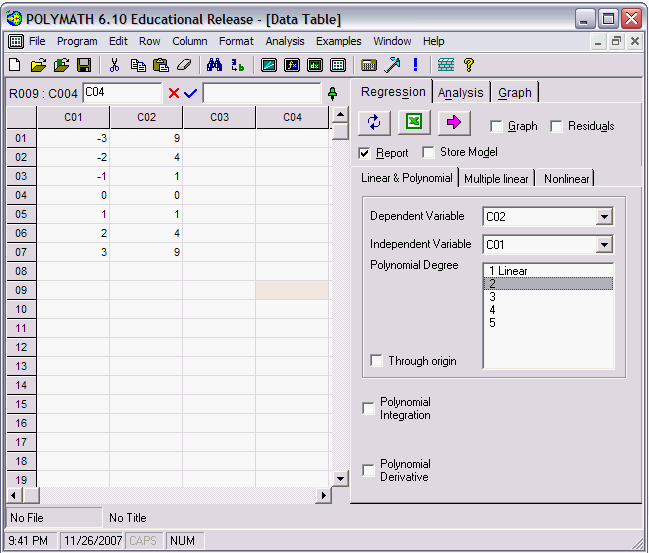
Screenshot of the POLYMATH 6.10 Educational Release window displaying a data table with columns C01 to C04. The regression settings on the right show that the dependent variable is C02 and the independent variable is C01, with an option to select polynomial degree (Linear, Polynomial degrees 2-5). Other options for Polynomial Integration and Derivative are also visible.

By selecting appropriate model, you should be able to find a good fit to your data.
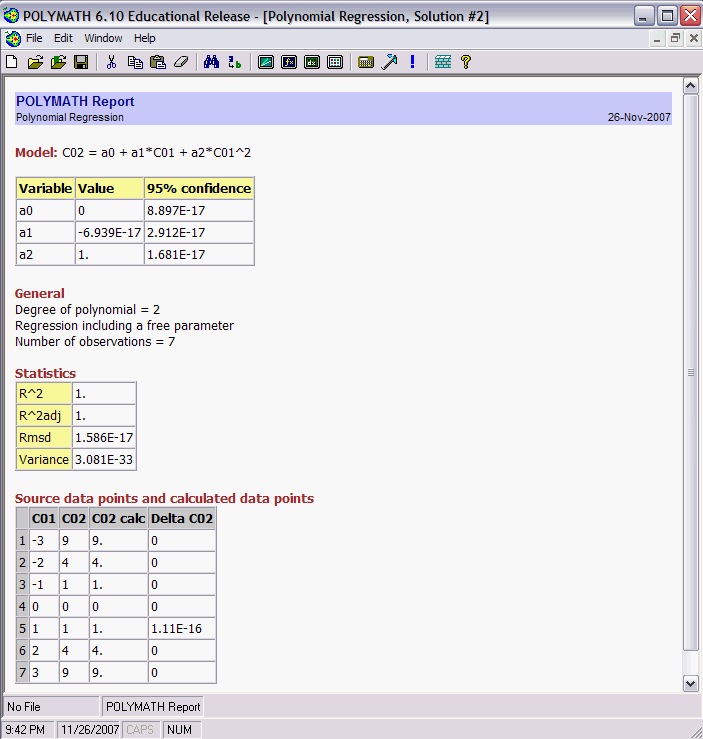
Screenshot of the POLYMATH 6.10 Educational Release window displaying the Linear Regression report. The model shows C02 = a0 + a1*C01 with the calculated values of a0 and a1, along with 95% confidence intervals. The statistics section displays R², R²adj, RMSd, and Variance. The source data points and calculated data points for C01, C02, and delta C02 are shown.


If you dont know what model you should use, try looking at a graph of your data by clicking on the "Graph" tab on the right of the screen. The graph creator window will come up.
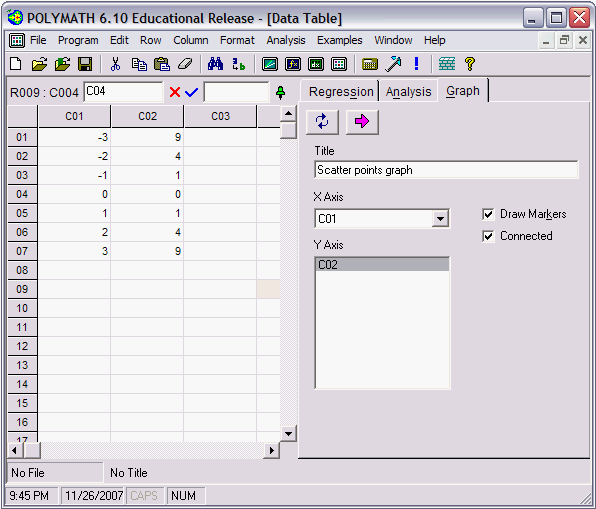
Screenshot of the POLYMATH 6.10 Educational Release window displaying a data table with columns C01, C02, and C03. On the right, the graph settings are shown with the title 'Scatter points graph'. The X axis is set to C01, and the Y axis is set to C02. The options to 'Draw Markers' and 'Connected' are checked.

By selecting the series that you wish to graph and clicking on the pink Solve arrow, a graph of the data will be displayed.
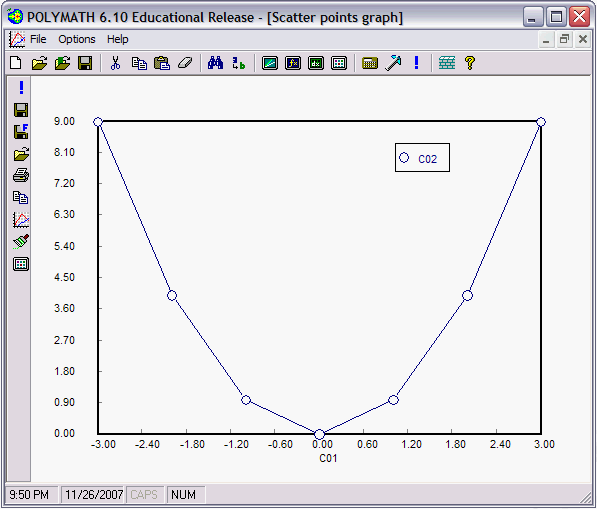
Screenshot of the POLYMATH 6.10 Educational Release window showing a scatter plot with data points labeled 'C02'. The graph plots C02 against C01, showing a curve with points at negative and positive values of C01. The points are connected by lines, and the legend indicates that the data series is for C02.


Polymath has much more to offer than just these features, so be sure to try different things out to see how they work.

Back to Chapter 7 Summary Notes