Chapter 11: Nonisothermal Reactor Design: The Steady State Energy Balance and Adiabatic PFR Applications
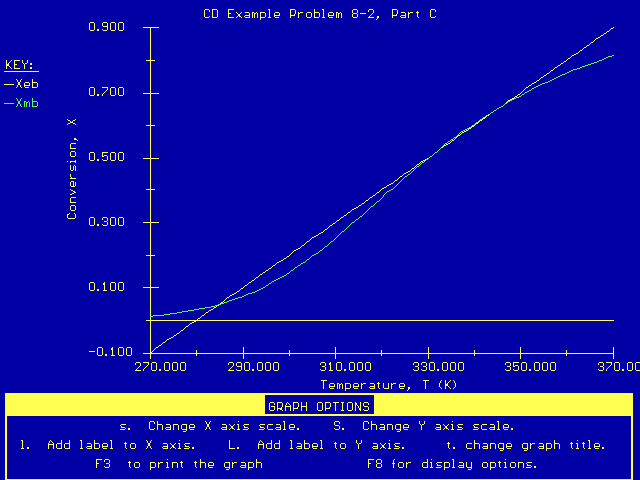
Plot of XEB and XMB versus T
| For Part C Second Order Reaction Carried Out Adiabatically in a CSTR |
|||
|
Our plot of X EB and X MB shows that we will have three possible operating points at:
X = 0.062 at T = 286 K (stable) It looks like the higher conversion, stable operating point (X = 0.75
at T = 355 K) will be our desired steady state.
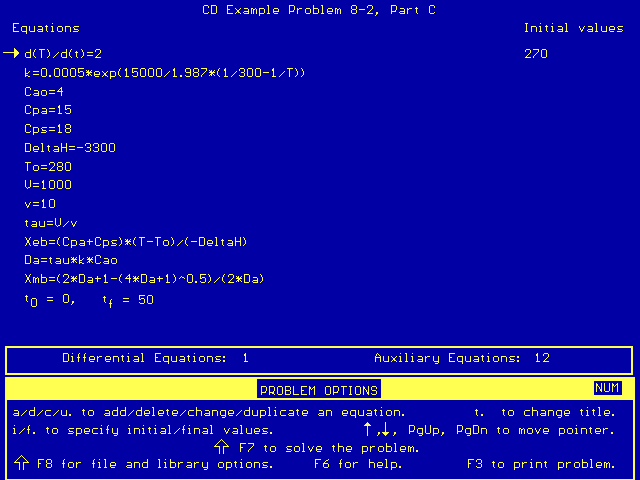
Our corresponding Polymath program looks like this:
NOTE: Our use of d(T)/d(t)=2 in the above program is
merely a way for us to generate a range of temperatures as we plot conversion
as a function of temperature.
|