Chapter 11: Nonisothermal Reactor Design: The Steady State Energy Balance and Adiabatic PFR Applications


Plot of XEB and XMB versus T

Second Order Reaction Carried Out Adiabatically in a CSTR
Our plot of XEB and XMB shows that our steady state operating point will be at:
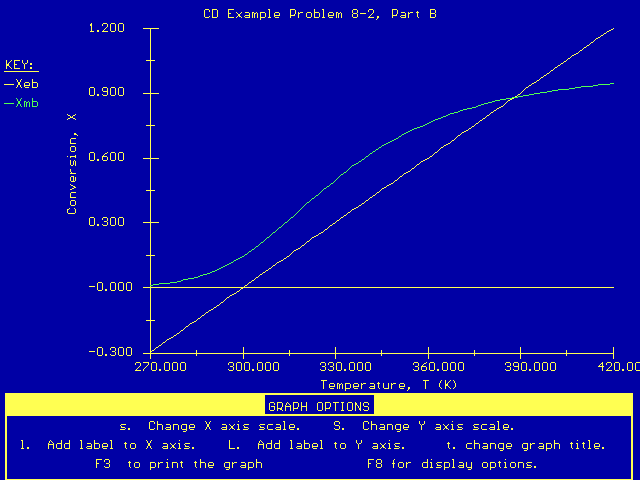
Graph titled 'CD Example Problem 8-2, Part B' showing two curves Xeb and Xmb. The x-axis represents Temperature (T) in Kelvin, and the y-axis represents Conversion (X). The yellow curve (Xeb) increases linearly, while the green curve (Xmb) increases nonlinearly and flattens out, intersecting the yellow curve around T = 355 K.

X = 0.87 and T = 387 K


Our corresponding Polymath program looks like this:
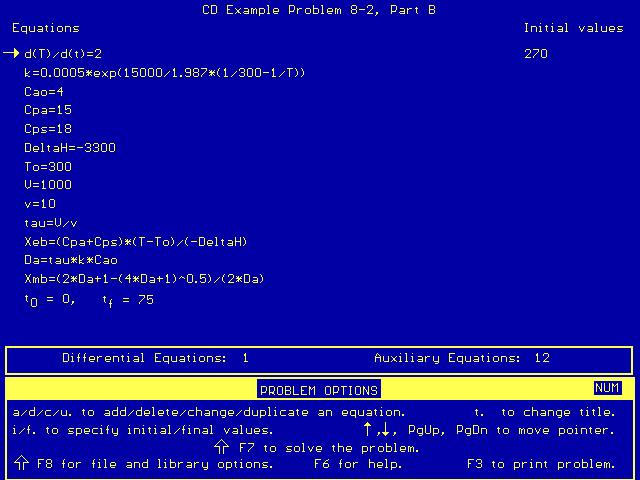
Blue screen showing input equations for CD Example Problem 8-2, Part B. It includes definitions for variables like k, Cao, Cpa, Cps, DeltaH, To, U, v, and expressions for tau, Xeb, Da, and Xmb. Initial temperature value is set to 270 K. The screen shows 1 differential and 12 auxiliary equations with options to modify the problem at the bottom.

NOTE: Our use of d(T)/d(t)=2 in the above program is merely a way for us to generate a range of temperatures as we plot conversion as a function of temperature.

Return