Chapter 9: Reaction Mechanisms, Pathways, Bioreactions and Bioreactors


Professional Reference Shelf

The following information is taken from the 4th edition of Elements of Chemical Reaction Engineering, so the equation numbers correspond to those found in that book

Physiologically Based Pharmacokinetic (PBPK) models
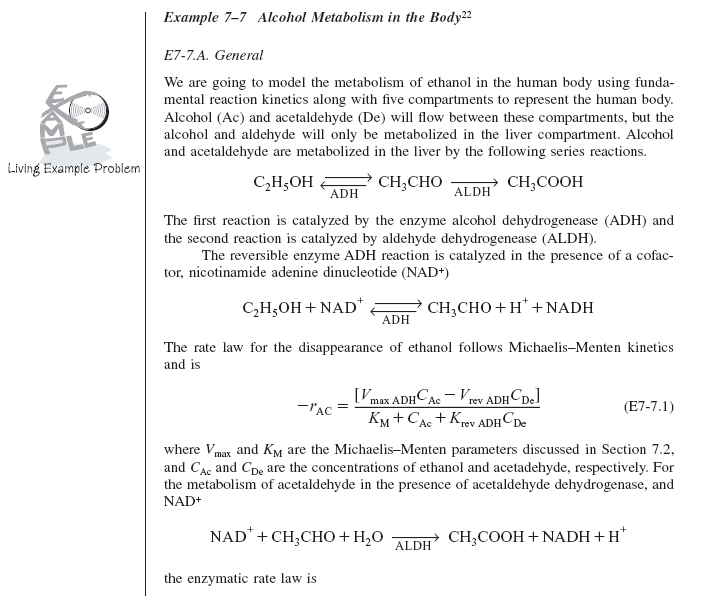
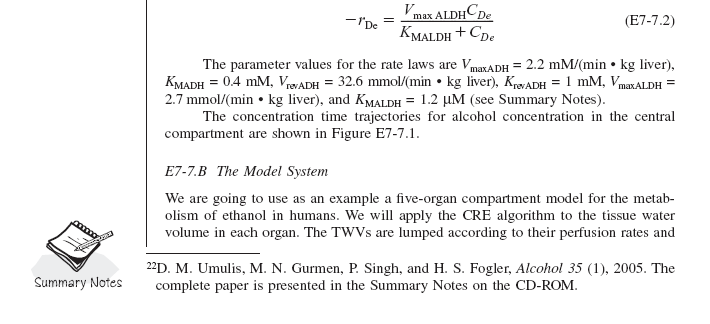
Page from a textbook showing Example 7-7: Alcohol Metabolism in the Body. It includes a description of ethanol metabolism, chemical equations for alcohol and aldehyde dehydrogenase reactions, and the Michaelis-Menten rate law for ethanol disappearance. The page also features a 'Living Example Problem' logo on the left.

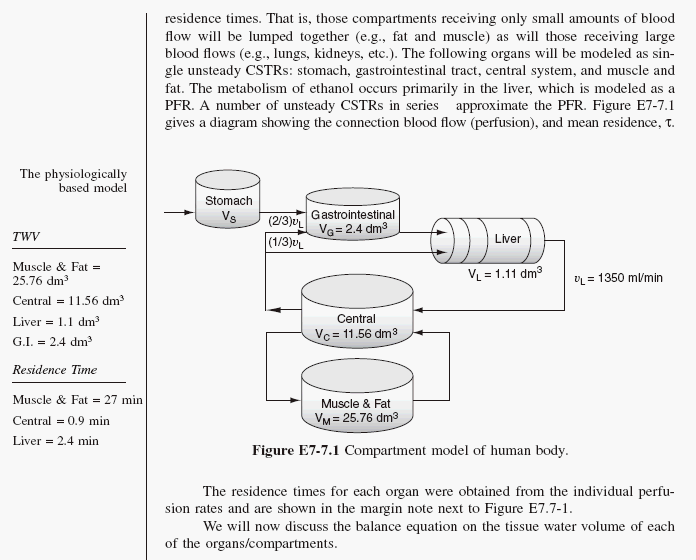
Textbook page showing equation (E7-7.2) for the rate of acetaldehyde metabolism, parameter values for the rate laws, and a description of a five-organ compartment model for ethanol metabolism. The page includes a 'Summary Notes' icon and a reference citation.

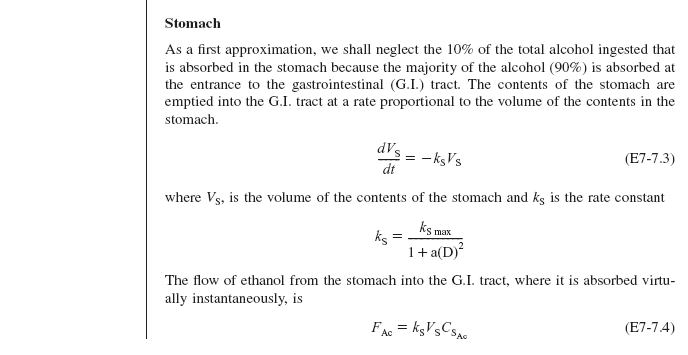
Diagram of a physiologically based compartment model for ethanol metabolism in the human body. It includes compartments for the stomach, gastrointestinal tract, liver, central system, and muscle & fat, with labeled tissue water volumes (TWV) and residence times. The liver is modeled as a PFR, while other organs are modeled as unsteady CSTRs. Figure E7-7.1.

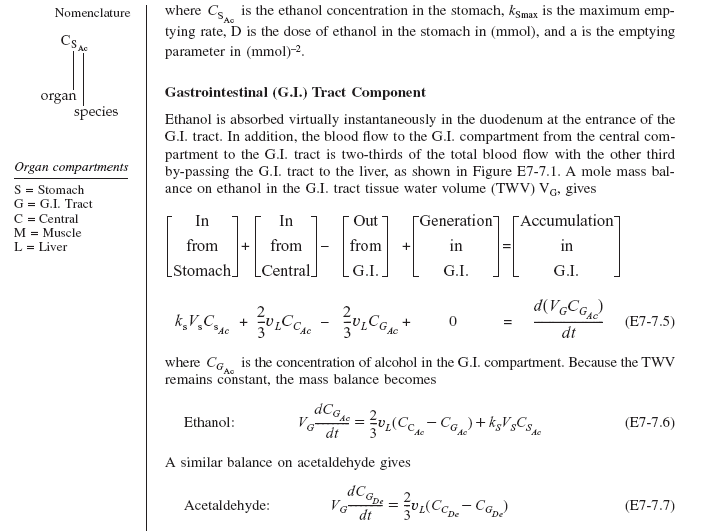
Textbook page discussing ethanol absorption in the stomach. It includes differential equations (E7-7.3 and E7-7.4) describing the rate of stomach content emptying into the gastrointestinal tract and ethanol flow using rate constant k_s.

Textbook page discussing the gastrointestinal (G.I.) tract component in ethanol metabolism. It includes a mass balance equation (E7-7.5) for ethanol in the G.I. tract, followed by differential equations (E7-7.6 and E7-7.7) describing ethanol and acetaldehyde accumulation. A nomenclature box defines organ compartments: stomach (S), G.I. tract (G), central (C), muscle (M), and liver (L).

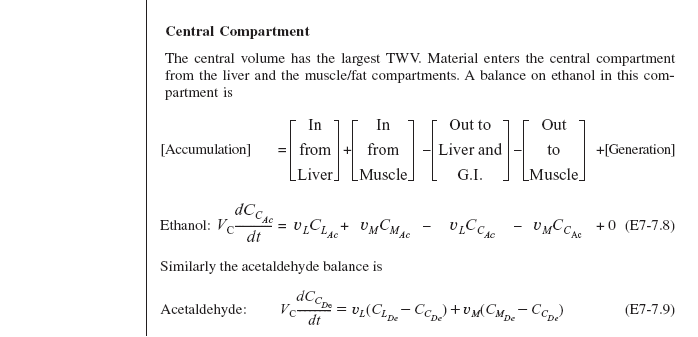
Textbook page discussing the central compartment in ethanol metabolism. It includes mass balance equations (E7-7.8 and E7-7.9) for ethanol and acetaldehyde, showing accumulation as a function of inflow from the liver and muscle, and outflow to the liver, G.I. tract, and muscle.

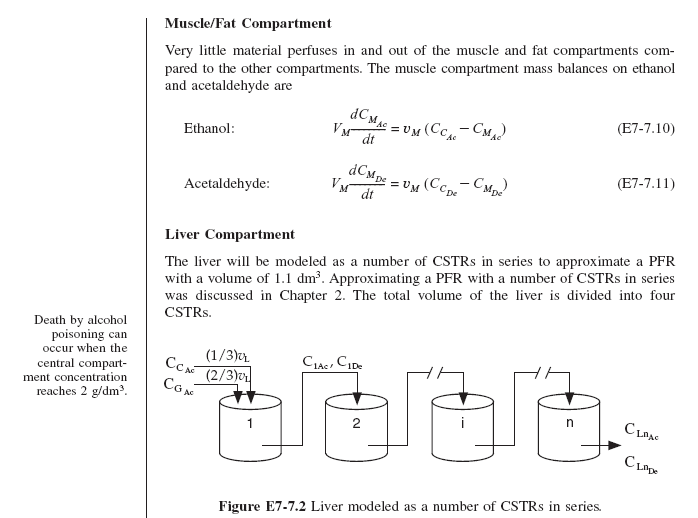
Textbook page discussing the muscle/fat and liver compartments in ethanol metabolism. It includes mass balance equations (E7-7.10 and E7-7.11) for ethanol and acetaldehyde in the muscle compartment. The liver is modeled as a series of CSTRs to approximate a PFR, with a diagram (Figure E7-7.2) showing ethanol and acetaldehyde flow through four compartments. A side note states that alcohol poisoning can occur when the central compartment concentration reaches 2 g/dm³.

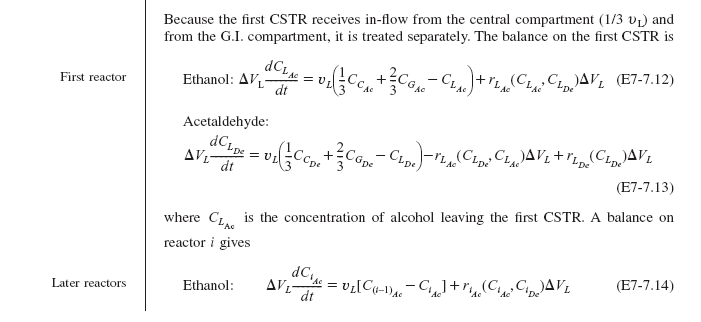
Textbook page discussing ethanol and acetaldehyde balance equations for the first and later CSTRs in the liver. Includes equations (E7-7.12, E7-7.13, and E7-7.14) describing ethanol and acetaldehyde concentration changes in the first reactor and subsequent reactors in series.

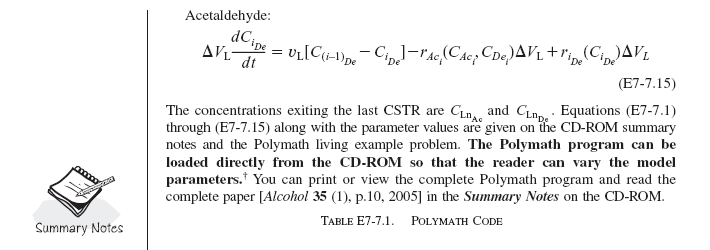
Textbook page discussing the final acetaldehyde balance equation (E7-7.15) for the last CSTR in the liver. Mentions that concentrations exiting the last reactor are C_LnAc and C_LnDe. Notes that the Polymath program can be loaded from the CD-ROM to vary model parameters. Includes a 'Summary Notes' icon.

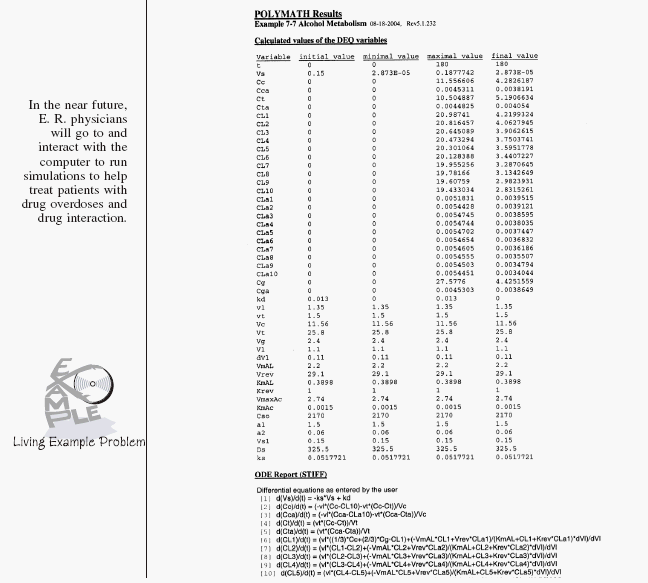
Textbook page showing POLYMATH results for Example 7-7 Alcohol Metabolism, including a table of DEQ variable values and an ODE report with differential equations. A sidebar notes that E.R. physicians may use computer simulations for drug overdose treatment. Features a 'Living Example Problem' logo.

Text excerpt discussing Polymath program compatibility. It states that the CD-ROM version was written for Polymath 5.1 and advises users of Version 6.0 or higher to reduce liver compartments from 10 to 9 to stay within the equation limit.

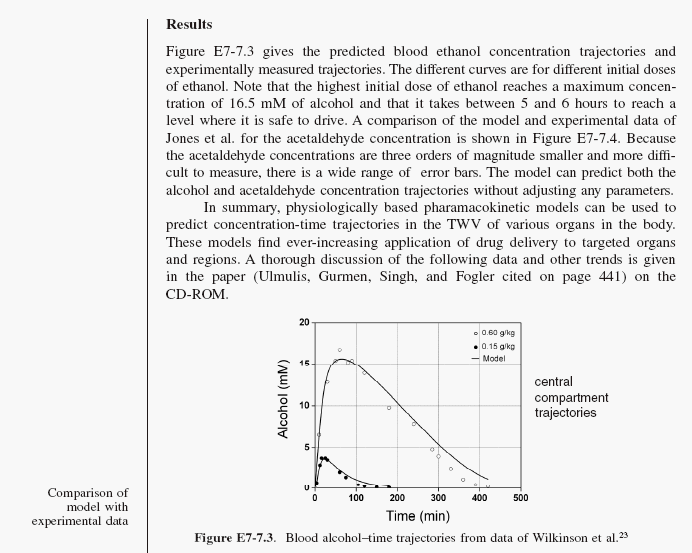
Textbook page presenting the results of a physiologically based pharmacokinetic model for ethanol metabolism. It includes a discussion of blood ethanol concentration trajectories and a comparison with experimental data. Figure E7-7.3 shows a graph of blood alcohol-time trajectories for different ethanol doses, with central compartment trajectories labeled. A sidebar notes 'Comparison of model with experimental data.'

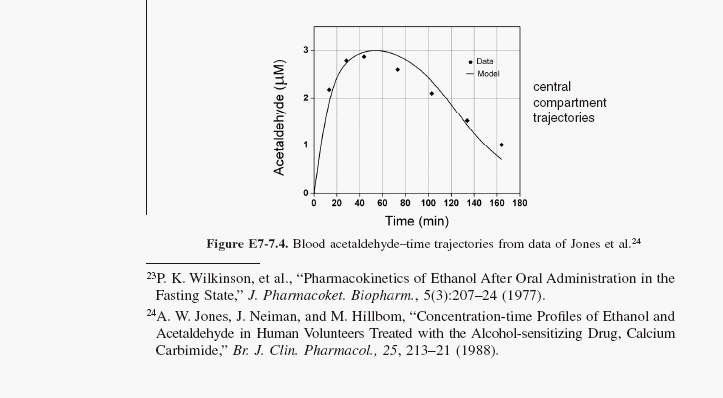
Graph from Figure E7-7.4 showing blood acetaldehyde-time trajectories from data of Jones et al. The graph compares experimental data points with a model prediction for central compartment trajectories. Below the figure, references cite studies on ethanol and acetaldehyde pharmacokinetics.