|
This page gives access to the results of a first study (Test 1) in which 14 human subjects experienced a virtual jet ski ride. Each ride was recorded in a log file. Each log file contains the time history of handlebar position, throttle position, speed, position on lake, and other information.
To represent these large data sets in graphical form, the Virtual Reality Modeling Language (VRML), a WWW standard, was used as a visualization tool. A VRML plug-in for the Web Browser used (Internet Explorer or Netscape) is required to see and interact with the data. As a VRML plug-in, we recommend the CosmoPlayer Version 2.1.1 for Windows. Other VRML plug-ins are available, but not recommended.
The CosmoPlayer Version 2.1.1 for Windows can be downloaded from the official site or by using our local copy (file "cosmo_win95nt_eng.exe").
Tabulated Results
Summary of information about the 14 human subjects and related tabulated data:
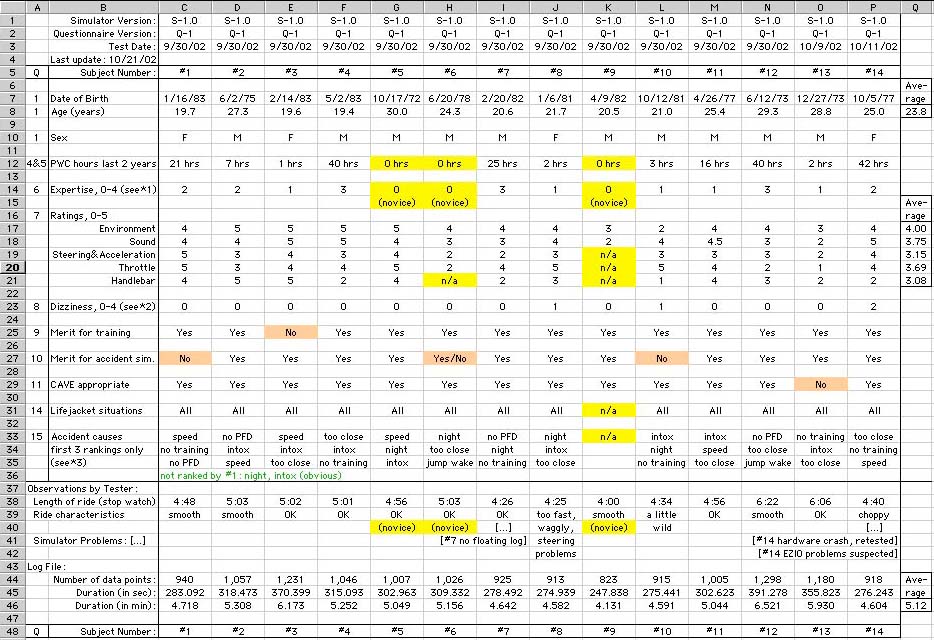 Table |
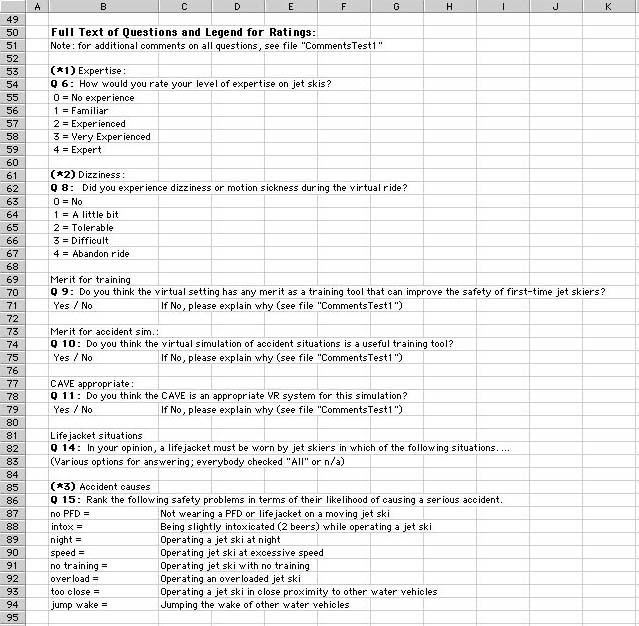 Legend |
Interactive Graphs: Time History of Speed, Throttle, and Handlebar Position
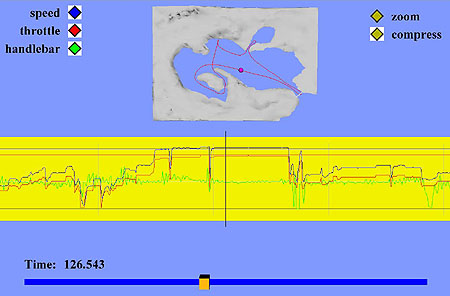
Sample Graph (screen copy from interactive VRML application):
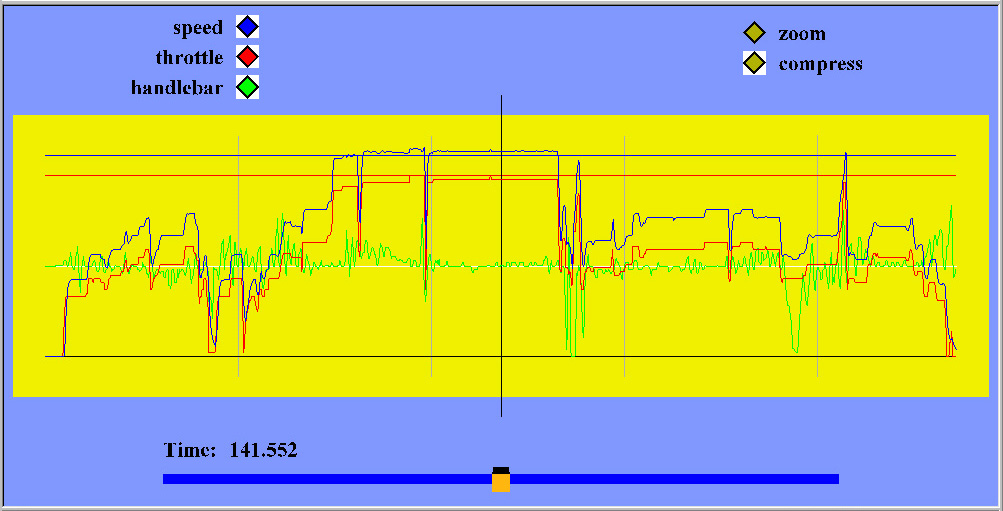
The Time Slider at the bottom allows to move the graph to the left and to the right. The current time (shown in seconds) corresponds to the position of the vertical black line crossing the graph.
The zoom and compress buttons control overall viewing options (the sample graph is shown with the compress option on).
The speed, throttle, and handlebar buttons toggle the display of the corresponding curve off/on.
The Speed Curve is shown in blue. The range is from 0 mph (horizontal black line at bottom) to 40 mph (blue line at top). Occasionally, the speed may exceed 40 mph.
The Throttle Position is shown in red and ranges from 0 (no throttle, black line) to 1 (full throttle, red line).
The Handlebar Position is shown in green. The range is from -1 (black line) to +1 (red line). A horizontal white line indicates the zero-position (going straight).
Statistics of Individual Rides
The following series of graphs show selected statistical data obtained by analyzing the individual rides. Each graph shows the same data item(s) for each of the 14 subjects.
The spreadsheet used to create these graphs can also be downloaded as Excel file stats1.xls.
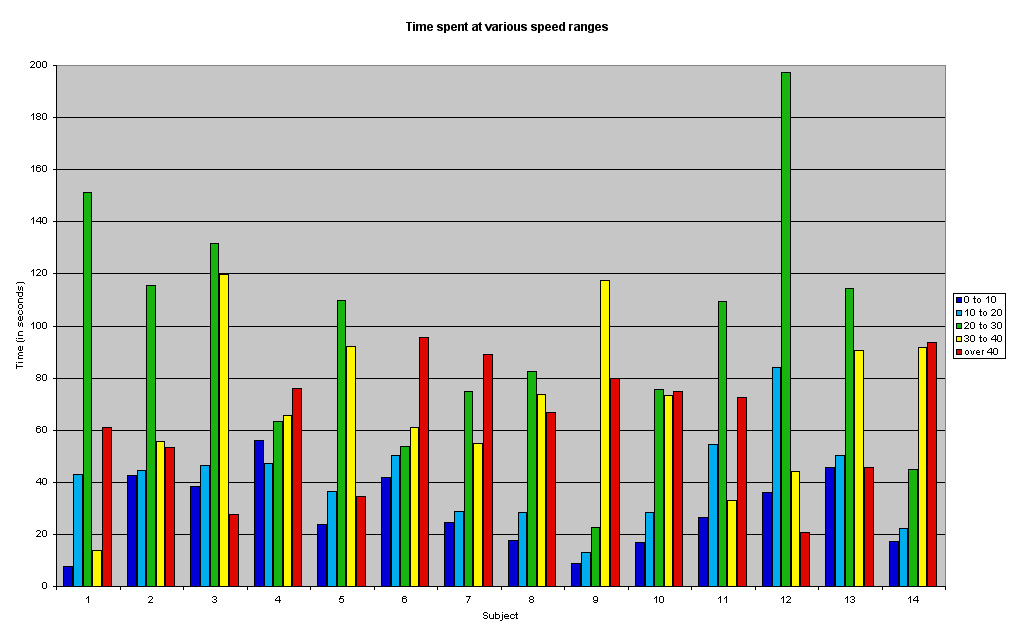 |
Time spent at various speed ranges | |
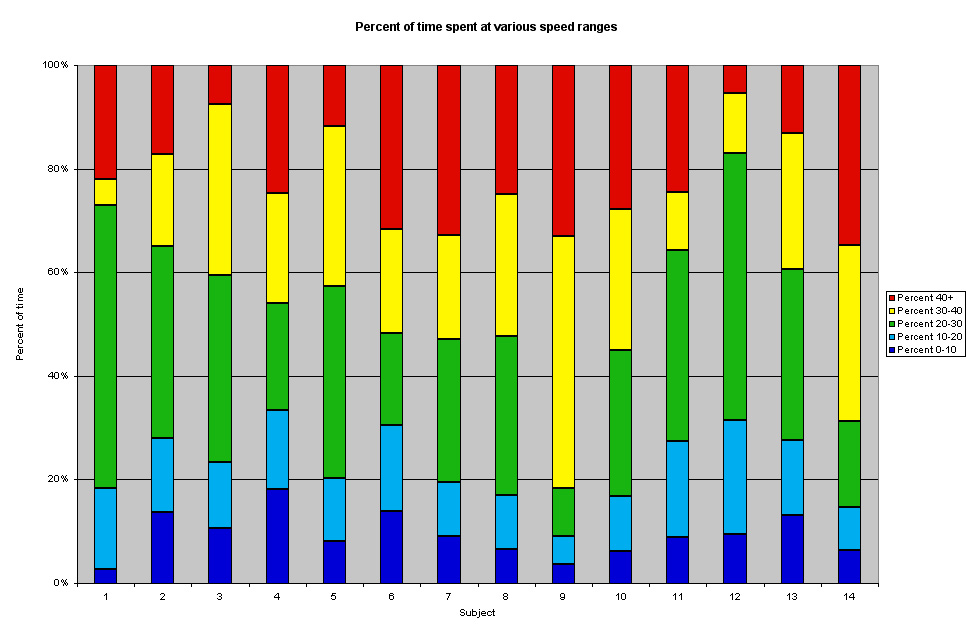 |
Percentage of time spent at various speed ranges | |
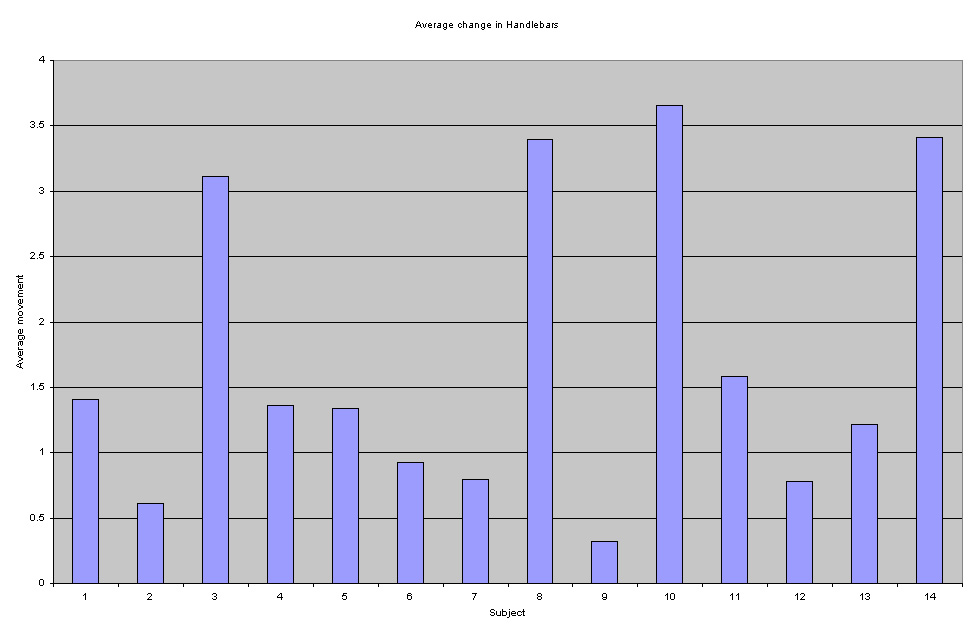 |
Average change in Handlebars | |
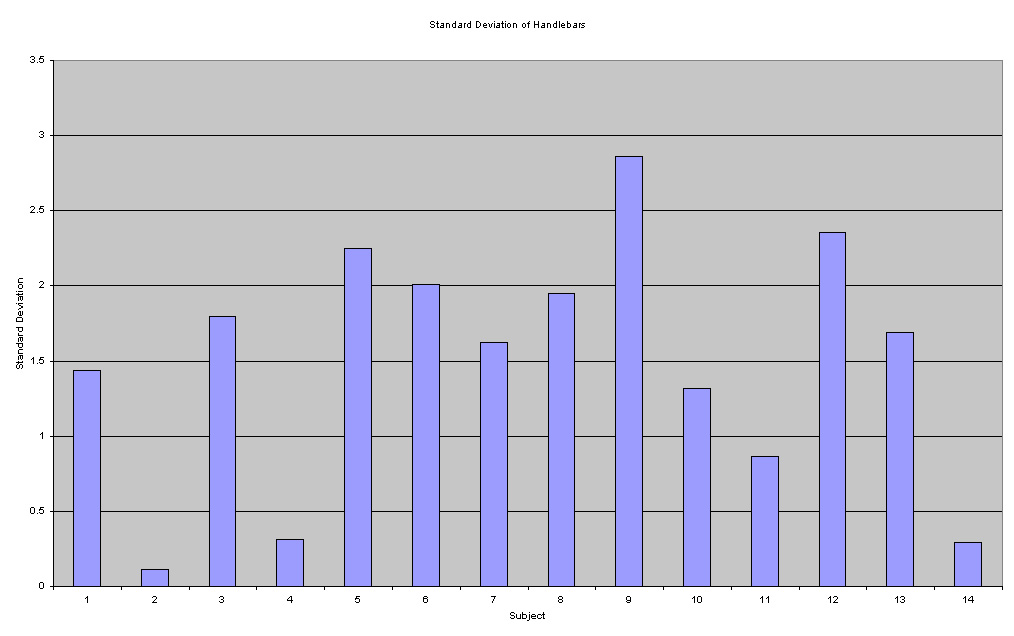 |
Standard Deviation of Handlebars | |
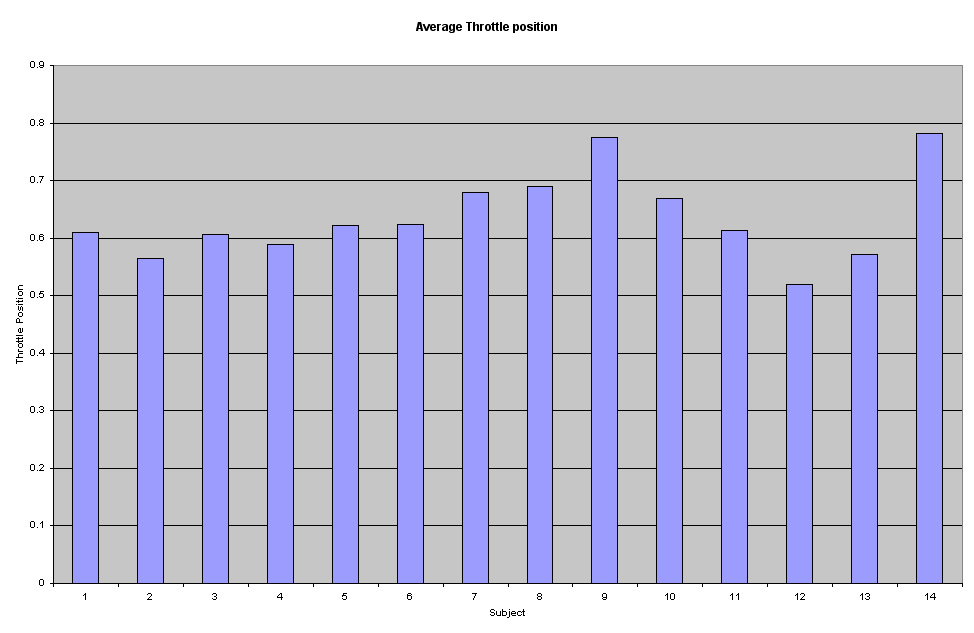 |
Average Throttle position | |
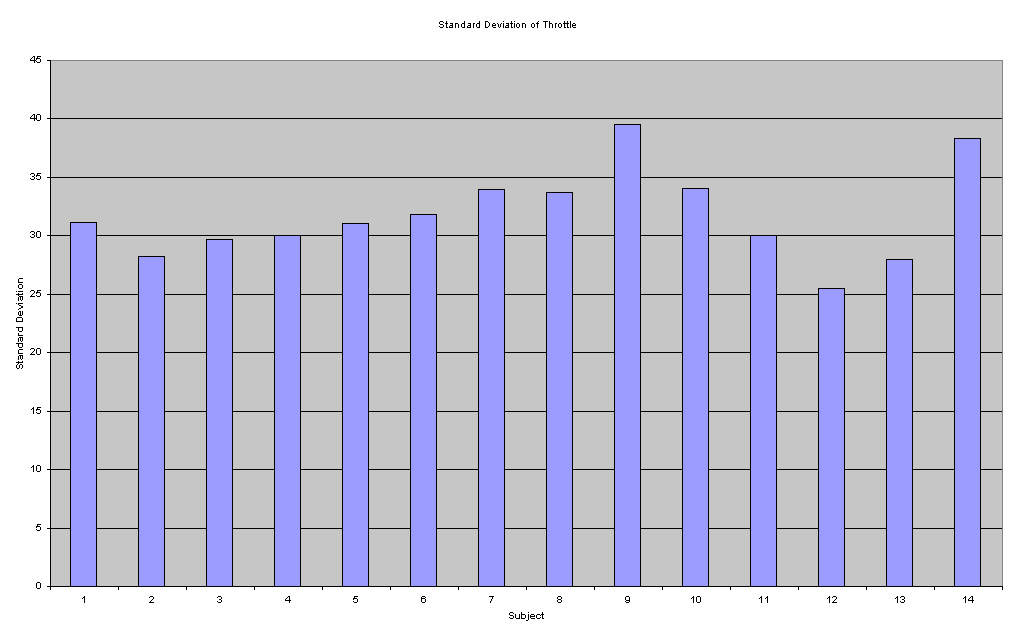 |
Standard Deviation of Throttle | |
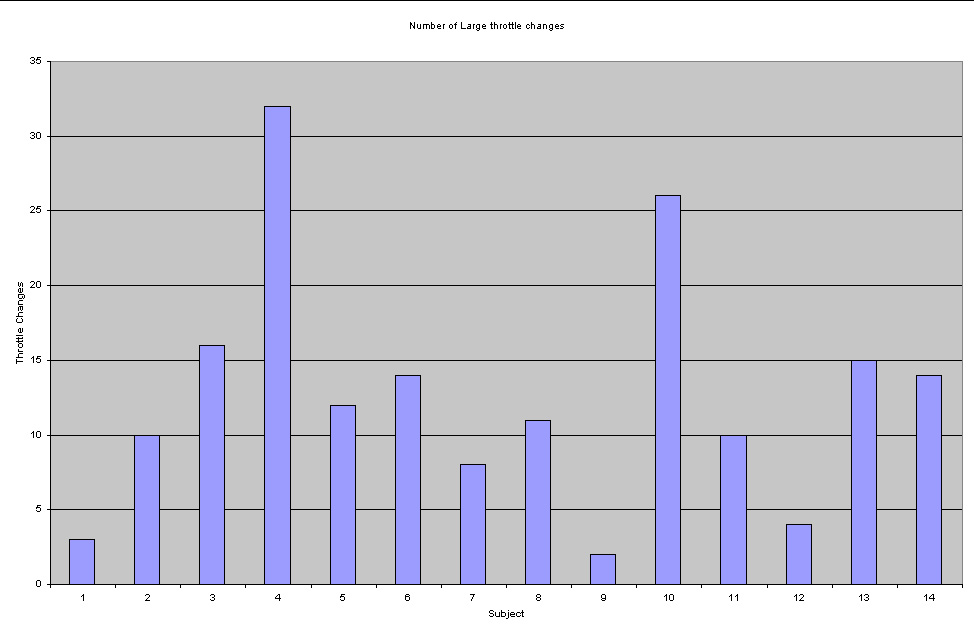 |
Number of Large throttle changes | |
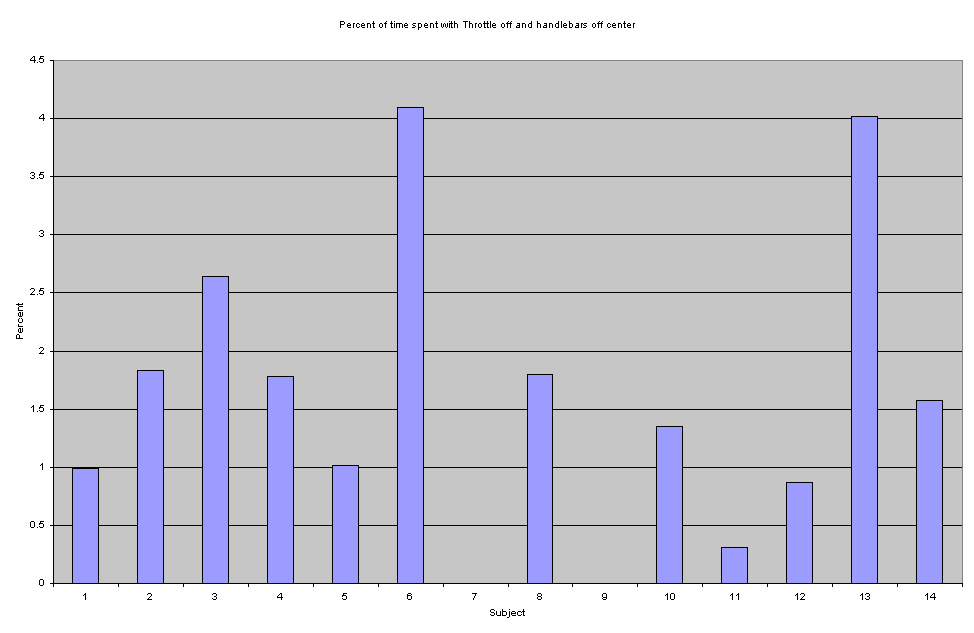 |
Poor Turning: Percent of time spent with throttle off and handlebars off center |