| Viewing the Problem First-Hand: The Off Spec Plastic | top |
In the mid 1970s a company in the United Kingdom completed a plant to produce a plastic product (PVC). The main piece of equipment was a large reactor with a cooling jacket through which water passed to keep the reactor cool. When the plant was started up, the plastic was dark, nonuniform, and way off design specifications. The engineers in charge reviewed their design. They reworked and refined their model and calculations. They analyzed the procedure from every point of view on paper. They had the raw material fed to the reactor analyzed. However, they all came up with the same results- that the product should definitely meet the design specifications. Unfortunately, nobody examined the reactor firsthand. Finally after many days, one of the engineers decided to look into the reactor. He found that a valve had been carelessly switched to the wrong position, thereby diverting cooling water away from the reactor so that virtually no cooling took place. As a result the reactor overheated, producing a poor quality product. Once the valves were adjusted properly, a high quality plastic was produced.
| Viewing the Problem Firsthand: A Shocking Installation | top |
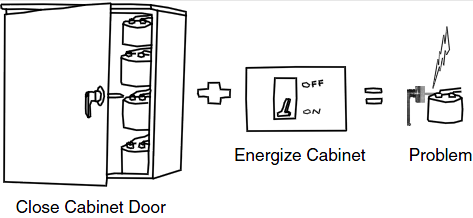
Dan, a technical salesperson for an electrical contractor, received a call on a Friday morning stating that an electrical cabinet-the installation of which he had overseen the previous day-had just exploded upon initial start-up. He was informed that 10 seconds after power was supplied to the cabinet, it exploded. Dan knew that it was imperative that the issue be resolved quickly because this particular piece of equipment was critical to the operation of his customer's plant. He sat down with the engineers at his company and pored over drawings, working nearly nonstop throughout the weekend-but came up with nothing. This same cabinet had been installed in other facilities with no problem, and, as far as he knew, nothing about its design or operation had changed.
Dan took it upon himself to drive 6 hours to investigate the problem firsthand. Upon his arrival at the facility, he was led to the shattered remains of the cabinet. He quickly confirmed that the cabinet had been wired to his company's specifications. Dan then decided to take a lunch break. As he walked away from the cabinet, he saw its door leaning against the wall. He noticed that the handle installed on the door was different from any he had ever seen installed on this particular style of cabinet. Out of mere curiosity, he opened the cabinet door. To his surprise, Dan saw a 2-inch rod sticking off the back of the handle, which was partially melted. When he questioned the plant manager about the handle, he learned that it was installed by the company's maintenance crew prior to start-up so that the plant skeleton key could be used to access the cabinet.
Dan had a hunch about the handle, so he took the cabinet door with him when he left for the day. Upon arrival at his office, he took the door and compared it to one installed on an identical cabinet. His hunch was correct: The rod extending from the back of the cabinet handle that his customer had installed was just long enough to touch a positive lead on one of the electrical components in the cabinet. Dan realized that this particular component acted like a battery, storing up electrical energy. When the handle touched this component, an electrical short-circuit occurred. Dan had found his problem and saved his company from a potential lawsuit.
| Visualizing Information: The Case of the Dead Fish | top |
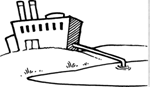
Research and information gathering are great tools in problem solving. Here we consider the case of a chemical plant that discharges waste into a stream, which in turn flows into a relatively wide river. Biologists monitored the river as an ecosystem and reported the following data regarding the number of dead fish in the river and the river level:
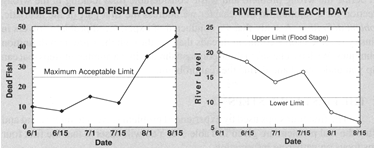
Graphs of the type shown above are called time plots and control charts. A time plot shows trends over a period of time (e.g., the level of a river over several days or weeks). A control chart is a time plot that also shows the acceptable limits of the quantity being displayed. For example, in the control chart of the river level, the upper and lower acceptable water levels would be shown. If one of the acceptable limits is exceeded, this occurrence may yield some information about the timing of the problem and its possible causes. We can then examine time plots of other pertinent quantities and look for additional clues about the problem.
From the graphs, we see that the acceptable level of dead fish was exceeded between July 15 and August 1. To investigate the source of this problem, we look for anything that might have occurred on or between July 15 and August 1. We discover that on July 29, a large amount of chemical waste was discharged into the river. Discharges of this size had not caused any problems in the past. Upon checking other factors, however, we see that there had been little rain prior to the discharge and that the water level in the river, measured on August 1, had fallen so low it might not have been able to dilute the plant's chemical waste. Consequently, the low water level, coupled with the high volume of waste, could be suggested as possible causes of the unusually large number of dead fish.

To verify our suspicion, we would have to carry the analysis further. Specifically, we would use one or more of the problem definition techniques discussed in Chapter 5.