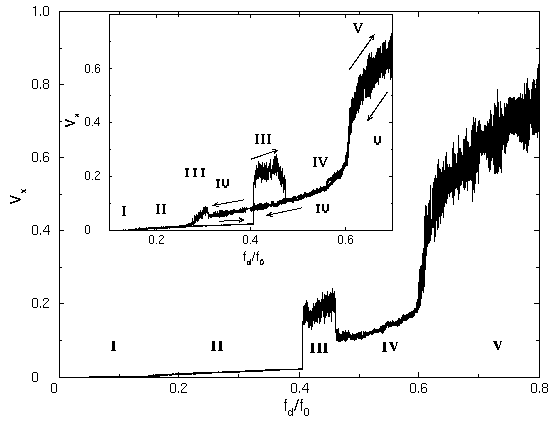
Average vortex velocity versus driving force for a field value slightly
above the matching field, with the pinning sites located in a square
array. The driving force is increased from 0 to 0.8. Several
remarkable jumps in the curve can be clearly seen which correspond
to transitions in the dynamical behavior of the driven lattice. To better
identify the phases we have numbered them I - IV. The inset
shows the hysteresis curve as the driving force is increased to 0.7 and
then decreased (phases now shown with unbold Roman numerals) to zero.
Some phase boundaries, II-III and III-IV, show hysteresis while
others do not.

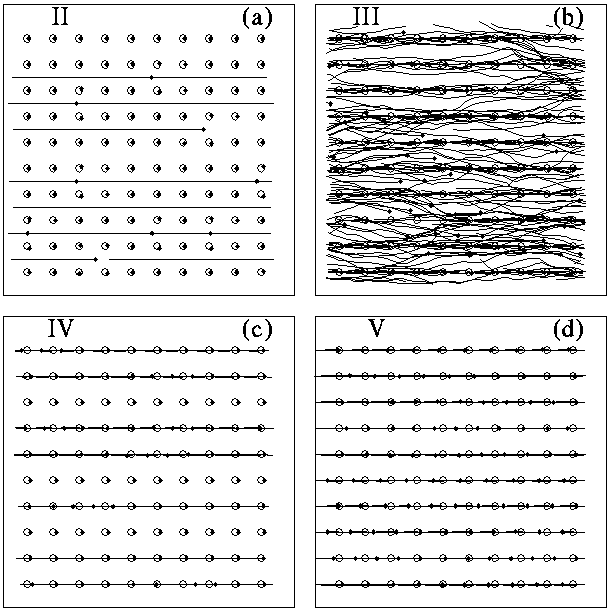
Trajectories of the east-bound flowing vortices, for the voltage-current
curve in Fig. 1, for regions: II, interstitial flow (a);
III, disordered flow (b); IV, incommensurate 1D flow (c); and V,
homogeneous flow (d). The vortices are represented by black
dots and pinning sites by open circles. For clarity, only a section
of the sample is shown.

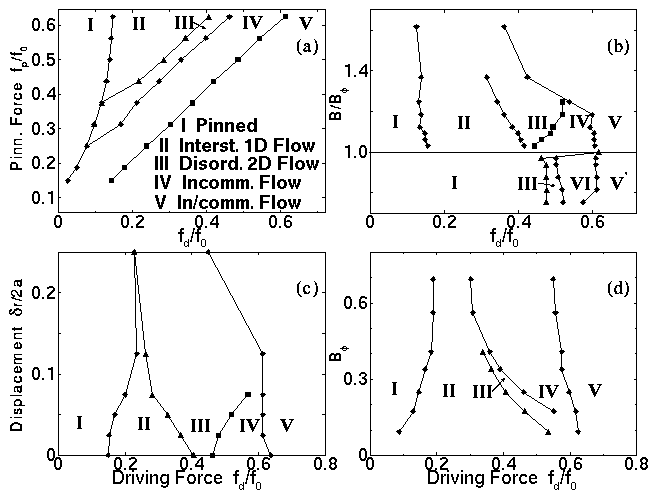
Dynamic phase diagrams with a square pinning lattice.
(a) Pinning force versus driving force. As the driving force is
increased, the phase boundaries II-III, III-IV, and IV-V become
linear. (b) Ratio of applied field to matching field plotted
versus driving force. For ratios greater than 1, regions I
through V can be observed, with the disordered region III
growing and the ordered-flow regions II and IV reducing
in size. (c) Phase diagram for gradually increasing
the amount of disorder in the location of the pins. (d)
Dynamic phase diagram for matching field versus driving
force.