![]()
PROCERA® ALUMINUM OXIDE BRIDGE
Finite Element Analysis of Dimensional
Differences
Involving the Length of the Pontic
Brien R. Lang, DDS, MS
Rui-Feng Wang, BS
Byungsik Kang, PhD
Lisa A. Lang, DDS, MS
Michael E. Razzoog, DDS, MS, MPH
INTRODUCTION
The reliability of the finite element method (FEA) to study layer beams was demonstrated in the study entitled, “PROCERA® ALLCERAM BRIDGE - Strength Measurements Using The Finite Element Method.” Clearly the Procera AllCeram bridge is a layered structure and therefore the FEA is a most appropriate method to studies the bridge components and their influence on strength.
The anteroposterior length of the pontic on the load bearing capacity of the Procera AllCeram bridge was another study initiated by the Center investigators. Eighteen (18) finite element models were created using the original model of the bridge as the prototype. The smallest pontic length was 3.0 mms from joint to joint as measured on the superior surface of the pontic. For each subsequent model the length of the pontic was increased by 1.0 mm. The 3.0 mm, 12.0 mm, and the 20.0 mm models are illustrated in Fig 1.
Fig. 1. The FEA Models Demonstrating Different Pontic Lengths
In the processing phase of the FEA, a 2000 N load was applied vertically and spread over five nodes on the occlusal surface in the center of each pontic. The load was applied in twenty (20) increments or until the 2000 N was reached. None of these elements in the aluminum oxide material forming the copings or the pontic reached a Von Mises value greater than 500 MPa which is well below the ultimate tensile strength (699 MPa) of the aluminum oxide material.
The Von Mises stress values in the veneer porcelain beneath the joints did reach values exceeding the yield point of the veneer porcelain. Elements numbered 13, 14, 15, 16, 18, and 25 in Fig. 2 were selected for analysis of their Von Mises values.
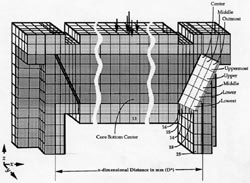
Fig. 2. The Elements Selected in the FEA Model for Analysis
The load at which the Von Mises stresses exceeded the yield point for the various elements are plotted in Fig. 3.
Fig. 3. The Load to Fracture For FEA Models
With Varying Pontic Lengths
Von Mises values that represented failure due to tensile stress are denoted by the solid line. The broken line in Fig. 3 represents values that are compressive stresses and failure will not occur in this element at the particular load being applied.
Element 13 located in the middle of the veneer layer along the lower border of the pontic demonstrated fracture at force applications of 800 N or lower only after the pontic length had exceeded 15.0 mms which would be rather large for a pontic in most patient situations. Elements 14, 15, and 16 located in the veneer porcelain beneath the joint experienced tensile stress up to a pontic length of 13.0 mms and then experienced compressive stress beyond that dimension. The load bearing capacity of these three elements were all in excess of 1200 N from the 3.0 mm pontic model through the 13.0 mm pontic. Element 18 also in the veneer porcelain beneath the joint experienced tensile stress in both the 3.0 mm and 4.0 mm pontic models. This element then experienced compressive stress in the 5.0 mm model through to the 20.0 mm pontic model. Element 25 located in the veneer material along the proximal margin of the coping experienced a tensile stress beginning with the 15.0 mm model, however fracture did not occur until the load was in excess of 1100 N.
From this study, it would appear that the optimum pontic length for the strongest possible bridge situation was the 9.0 mm model where fracture due to tensile stress in elements 14, 15, and 16 would not occur until a load of 1300 N was experienced. It would also appear from the FEA data that any bridge with a pontic length of up to 15.0 mm would be able to withstand a load of 800 N or higher without failure when subjected to a vertically directed force.
SUMMARY of the RESEARCH FINDINGS
Within the limitations of this studies the following can be concluded
The Procera AllCeram bridge has the strength to withstand 800 N of force when the pontic length is 9.0 mm through to 12.0 mm, and the direction of the load application is vertical.
Close Window to continue.