![]()
PROCERA® ALUMINUM OXIDE BRIDGE
Finite Element Analysis: Load to Fracture
of
the Procera All-Ceramic Bridge
Brien R. Lang, DDS, MS
Rui-Feng Wang, BS
Momo Vasilic
OBJECTIVES: Historically, the strength of any all-ceramic
bridge has been a major question. Therefore, a study was initiated comparing
load to fracture mechanical test data with finite element analysis of
a 3-unit Procera® bridge as influenced by 1) the joint between the
3 ceramic units, and 2) various luting agents used to cement the bridge.
Methods: Five bridges were constructed by the CAD/CAM method and
cemented on dies with Fuji Plus for mechanical strength testing using
the Instron machine. The all-ceramic bridge was also modeled for finite
element analysis.
Results: From the FEA, cement failure occurred before joint failure
with Zinc Phosphate (382 N). The joint failed at approximately the same
load and before the cement for Fuji Plus (821 N) and Panavia 21 (870 N).
In the mechanical test, failure occurred at 697 ± 102 N (Fuji Plus).
Conclusions: The mechanical test load to fracture data for Procera
AllCeram Bridge in this investigation was 697 ± 102 N. The FEA
load to fracture data for the Procera Test Bridges cemented with Fuji
Plus was 821 N and was 870 N for Panavia 21. Bridge failure in both the
mechanical tests and the FEA was initiated at the lower joint border and
progressed upward through the joint to the occlusal surface.
INTRODUCTION
The Procera® AllCeram Bridge combines CAD/CAM produced aluminum oxide copings with an all-ceramic pontic to create a 3-unit restoration.[1-4](Figure 1) Historically, the strength of the all-ceramic bridge has been a major question. Therefore, a study was initiated comparing load to fracture mechanical test data with finite element analysis to determine the strength of the Procera AllCeram bridge when cemented using three different cements.
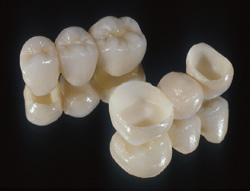
Fig. 1. The Procera® AllCeram 3-Unit Bridge
MATERIALS AND METHODS
This study consisted of two parts:
1) Mechanical Strength Test of the Procera Bridge when cemented with Fuji
Plus, and
2) Finite element analysis (FEA) of the bridge when cemented with Zinc
Phosphate, Fuji Plus or Panavia 21.
Mechanical Strength Test
Five Procera AllCeram bridges were provided for mechanical strength testing
(Nobel Biocare, USA). All five bridges were similar in design and dimensions,
having been fabricated from a master set of dies and articulated casts.
In addition to the bridges, special dies were provided that were machined
from a resin material with properties similar to human dentin. An acceptable
fit was observed between all of the dies and their individual abutments
in the five bridge assemblies. For each bridge, dies were positioned and
secured within their respective crowns. A cast was poured in improved
stone with the occlusal surfaces of the 3-units being parallel to the
base of the cast. Each Procera bridge was cemented onto their dies using
a resin modified glass reinforced ionomer cement (Fuji Plus). The cemented
bridges and their stone casts were stored in an environment similar to
oral conditions for five days. After five days, each cast/bridge was positioned
in a specially designed holder and placed in the Instron machine. An Instron
loading rod with a tip 2.0 mms in radius was positioned in the center
of the superior surface of the pontic(Figure 2).

Fig. 2. The Procera® AllCeram Bridge Prior to Loading
Finite Element Analysis
For the FEA, abutment teeth (molars) were modeled with a chamfer finish
line and an 8-10 degree axial wall taper. The design was circular and
dimensioned similar to what one would achieve preparing a maxillary molar.
A cement space between the tooth and the coping was modeled with a uniform
thickness of 0.060 mms. The abutment teeth were 12.0 mms in diameter positioned
on either side of the pontic. The copings were a uniform thickness of
0.600 mms. The pontic was designed with a width of 6.0 mms and a height
of 6.0 mms. The length at the inferior border of the pontic was 6.0 mms
and the superior border was 10.5 mms. The joint between the copings and
the pontic was configured with a specific design for the Procera connecting/fusing
material. The slope of the joint formed an angle of approximately 25 degrees
with the vertical wall of the pontic. The area of the joint was 12.0 mms2
The space between the coping and the pontic in the joint area was 0.050
mms. The finite element model for the Procera Test Bridge is illustrated
in Figure 3 and was created using the software program HyperWorks®.

Fig. 3. The Finite Element Model of the Procera Bridge
In the model, the teeth were allowed to move slightly at
their base horizontally to simulate a not-so-firm relationship in the
jawbone. To achieve this function “springs X and Y” finite elements
with a stiffness = 2 (N/mm) were used at the interface between the base
nodes of the teeth and the supporting constraints. Spring element were
also used between the tooth and cement and cement and coping in the model.
In an earlier FEA, it was determined that using spring elements created
more exacting mechanical test results in strength testing of a Procera
coping.[5] The remaining contact interfaces in the model were ‘Node
to Surface’ at the interfaces between the copings and pontic in the
joint space. A loading rod positioned in the center of the pontic applied
a load of 3000 Newtons (N) to the test model. The software used for the
finite element analyses was ABAQUS Standard 3D 6.2 software. The model
was replicated to create three models, one for each of the three cements
being examined to determine the load to fracture or strength of the Procera
Test Bridge. The physical properties of the specific materials used in
the finite element models are presented in Table 1.
|
Table 1: Material Specifications for FEM Model
|
||||
|
Density
in Mg/mm3 |
Mod. of Elast.
in MPa |
Poisson's
ratio |
Ult. Stress
in MPa |
|
| Alum. Oxide |
3.97E-09
|
380000
|
0.25
|
508
|
| Dentin |
2.1~2.2E-9
|
12~14000
|
0.3
|
240
|
| Zinc Phosphate |
3.94E-09
|
13400
|
0.35
|
4.5
|
| Fuji Plus |
2.52E-09
|
6400
|
0.25
|
33.9
|
| Panavia 21 |
2.52E-09
|
7500
|
0.25
|
45
|
| Connecting and fusing materials |
3.72E-09
|
104000
|
0.3
|
260
|
RESULTS
The mean load to fracture during the mechanical test of the Procera AllCeram Bridges was 697 ± 102 N. During loading, the first signs of fracture occurred along the lower border of the joint area in the Procera AllCeram porcelain. A total fracture of the joint involving the Procera connection/fusing material followed the initial failure.
The distribution of stresses in the various areas of the finite element models can be determined by matching the colors in each element to the scale in the FEA report (Figure 4). The standard eight (8) color system was used in each report. The red color always represented the higher Von Mises value and the blue the lowest value. In the bridge models, high Von Mises stress values were concentrated in the loading region and the area directly beneath the lowest part of the coping/pontic joint extending into the copings, cement and teeth.
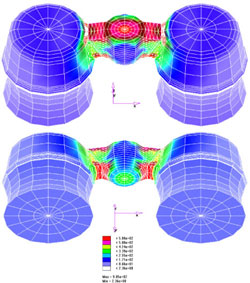
Fig. 4. Von Mises Stress Distributions for the Procera Test Bridge Model
This typical stress pattern was observed in all bridge models. The high Von Mises stress concentrations in all models were extended from the pontic through the joint to the sides of the copings (Figure 5). In the bridge models, the loading was uniaxial in direction and the normal stress component in the XX-axis was the major contributor to the stress patterns as compared to the other normal stress components YY and ZZ (Figure 6).

Fig. 5. Von Mises Stress Distribution for the Procera Test Bridge Model

Fig. 6. Primary Stress-XX Distribution for the Procera Test Bridge Model
Figure 7 illustrates the Von Mises stress distribution and Figure 8 the primary stress-XX distribution at the cement and the joint spaces of the Procera Test Bridge models. Comparing the Von Mises stress values of each element with the ultimate tensile strengths of the materials in Table 1 establishes the load to failure data.

Fig. 7. The Von Mises Stress Distributions for the Cement and Joint

Fig. 8. The Primary Stress-XX Distributions for the Cement and Joint
Table 2 presents the load to fracture data (FEA) by model, cement, joint, and coping.
|
Mtl.
|
Load to
Fract. |
Load to
Fract. |
Mtl.
|
Load to
Fract. |
|
| Zinc Phos. |
|
872.95
|
3345.08
|
||
| Fuji Plus |
2844.22
|
820.56
|
2993.62
|
||
| Panavia 21 |
3807.82
|
869.83
|
3323.07
|
||
DISCUSSION
The three-dimensional nature of an all-ceramic bridge makes an accurate representation of the Stress State and the failure potential very critical, which are strengths of the FEM and the Von Mises theory of analysis. Von Mises stress levels are a combination of Normal Stress Components in the XX. YY, ZZ-axes, and Shear Stress Components in the XY, YZ, XZ-axes (Figure 7). It becomes important to be sure that the major normal stress component contributing to the Von Mises stress value is tensile stress and not compressive stress when evaluating each element in the bridge model. A positive normal stress component is recognized as a tensile stress while a negative value represents compressive stress.
In this FEA, the elastic behavior of each element was analyzed for its Von Mises stress value, as was its primary stress-XX value. In Figure 8, the stress-XX distribution in the upper region of the pontic are compressive stress (a negative stress in the XX-axis), and the ceramic would not fail in this region even though the Von Mises values exceed the ultimate tensile strength of the material in the element.
The stresses in the lower region of the pontic are positive and the areas are experiencing tensile stress. If the Von Mises value of an element in Figure 7 exceeded the ultimate tensile strength of the bridge materials, and that element in Figure 8 was in an area of tensile stress, then failure would occur in this areas. The primary areas of interest with respect to potential failure of an all-ceramic bridge is the lower joint space between the coping and pontic. Figures. 7 and 8 illustrate the Von Mises stress distribution and the primary stress-XX distribution in the cement and the joint spaces of the Procera Test Bridge model.
If one disregards the earlier failure data of the Zinc Phosphate cement, then FEA failure of the joint was predicted at 873 N.
When the bridge was cemented with Fuji Plus or Panavia 21, the first area to demonstrate a Von Mises stress value that exceeded the ultimate tensile strength was in the connection/fusing material at the lower border of the coping/pontic joint. For these cements, the load to failure that produced the Von Mises stress values were 821 N for Fuji Plus and 870 N for Panavia 21.
It has been reported by Craig[6] that the average biting force on adult teeth in the first and second molars is 665 N (Newton), the premolars 450 N, and the incisors 220 N. However, chewing forces are lower than biting forces. Chewing forces with a fixed bridge are about 40% of the biting force exerted by the patient on the natural tooth side. Therefore, it would seem appropriate to use the average biting force (665 N) reported by Craig for adult natural teeth in the molar area to establish the Procera AllCeram bridge target strength.
The mechanical test load to fracture data for Procera AllCeram Bridge in this investigation was 697 ± 102 N. The FEA load to fracture data for the Procera Test Bridges cemented with Fuji Plus was 820 N and Panavia 21 was 870 N. The mechanical test data and the FEA data demonstrated that the Procera AllCeram Bridge exceeded the 665 N target strength.
When the bridge was cemented with Zinc Phosphate, the load on the pontic produced a Von Mises stress value in the cement in the area where the coping joins the pontic that exceeded the strength of the cement (4.5 MPa). It was further determined that this was an area of tensile stress and that the potential for fracture of the cement was possible at 382 N (Table 2). This result will require additional mechanical tests using Zinc Phosphate to cement Procera bridges to either prove or refute the data.
CONCLUSIONS
Within the limitations of this study, the following conclusions
can be made:
Mechanical test and FEA results demonstrated that the Procera AllCeram
Bridge has the strength to withstand loads greater than 800 N when the
bridge is cemented with Fuji Plus, or Panavia 21.
REFERENCES
1. Andersson M, Razzoog ME, Odén A, Hegenbarth EA,
Lang BR. PROCERA: A new way to achieve an all-ceramic Crown. Quintessence
Int 1998;29:285-296.
2. Andersson M, Odén A. A new All-Ceramic Crown: A densely-sintered,
high-purity alumina coping with porcelain. Acta Odontol Scand 1993;51:59-64.
3. Russell MM, Andersson M, Dahlmo K, Razzoog ME, Lang BR. A new computer-assisted
method for fabrication of crowns and fixed partial dentures. Quintessence
Int 1995;26:757-763.
4. Hegenbarth EA. Procera aluminum oxide ceramics: A new way to achieve
stability, precision, and esthetics in all-ceramic restorations. Quintessence
Dent Tech 1996:23-34.
5. Wang R-F and Lang BR. Finite element analysis: Determining bond strength
and mode of failure of three luting agents used with Procera® crowns.
IADR, #3410, March 2002.
6. Craig RG and Powers JM. Mechanical Properties In: Restorative Dental
Materials. 11th Edition CV Mosby Co., 2002. P. 68-124.
Close Window to continue.