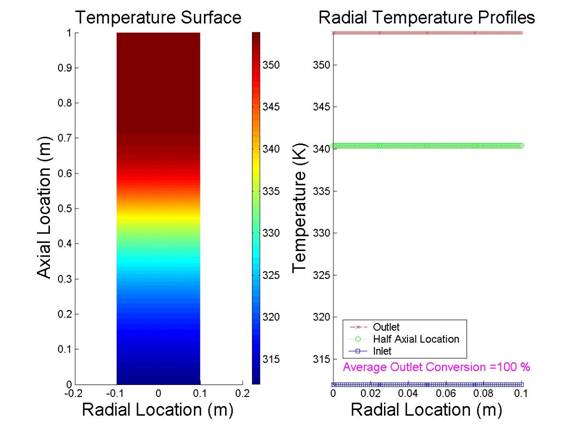
Solving the mass and energy balance using the boundary and initial conditions stated above gives the following graphs demonstrating the temperature profile in the reactor.
The Temperature Surface plot displays a cross-section of the temperature profile. It clearly shows the temperature rise along the length of the reactor, presenting the effect of the exothermic reaction.
The Radial Temperature Profiles plot displays the radial profile at three different locations: At the inlet, the outlet and half way through the reactor.
This solution is more or less equal to the solution you would get using Polymath, assuming the diffusivity and the thermal conductivity to be zero. These assumptions do not affect the result much since the neglected terms not are significant.
However, say we add a cooling jacket that gives us radial effects that we can not neglect; in that case the solution in Polymath would not be the same as the one you get using COMSOL Multiphysics.
|
|