Dissolution catalysis is the process in which a species that has no dissolving capacity is added to a system to accelerate the rate of dissolution. To illustrate this process, we shall consider the aluminosilicate system discussed in the Learning Resources section, except that this time we will add a dissolving catalyst B (e.g., H+ ). In this system, B can only adsorb on specific sites on the surface, S´ . These sites are different from those sites upon which A can adsorb.
The adsorption process shown schematically in Figure R10.4-1 can be written symbolically as
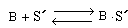
(R10.4-1)
Next we have the adsorption of A (HF) on S-type sites (Figure R10.4-2):
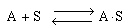
(R10.4-2)
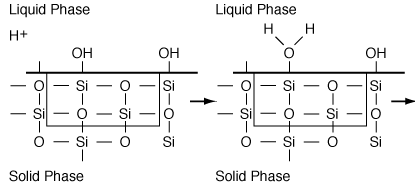
Figure R10.4-1
Adsorption of H+ (i.e. Species B)
Figure R10.4-2
Adsorption of HF (i.e. Species A)
Finally, the surface reaction takes place in which silicon and oxygen are removed from the surface exposing the next layer of silicon and oxygen (Figure R10.4-3). The surface reaction is

(R10.4-3)
and the corresponding rate law for the catalytic dissolution is
(R10.4-4)
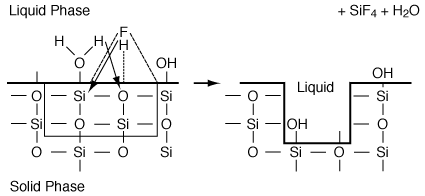
Figure R10.4-3
Surface reaction
Because the adsorption of B is not rate-limiting,
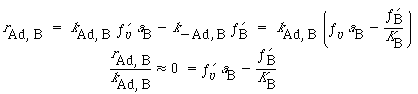
Solving for the fraction of S´ sites occupied by the catalyst B gives us
(R10.4-5)
from a site balance of only those sites on which B can adsorb:
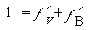
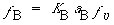
(R10.4-6)
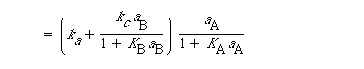
Combining Equations (R10.3-19), (R10.4-4), (R10.4-5), and (R10.4-6), we obtain
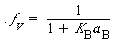
(R10.4-7)
(R10.4-8)
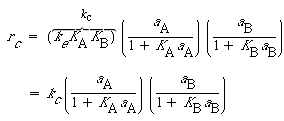
The total rate of dissolution is the sum of the uncatalyzed rate [Equation (R10.3-19)] and the catalyzed rate [Equation (R10.4-8)]:
(R10.4-9)
(R10.4-10)
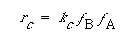
The degree of catalysis, D AC ,is defined as the catalyzed rate minus the uncatalyzed rate, divided by the uncatalyzed rate:
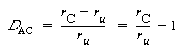
(R10.4-11)
Substituting for the uncatalyzed rate equation (R10.3-19) and the catalyzed rate equation (R10.4-8) gives
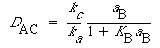
(R10.4-12)
Figure R10.4-4 shows a plot of the degree of catalysis as a function of hydrogen ion activity for the dissolution of the aluminosilicate kaolinite. Taking the reciprocal of Equation (R10.4-12), we obtain
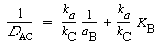
(R10.4-13)
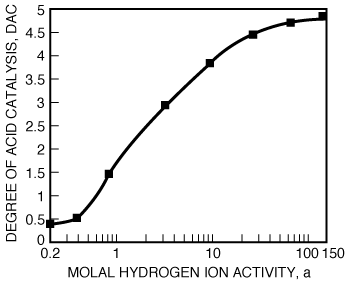
Figure R10.4-4
Acceleration of kaolinite dissolution rates by HCI
Figure R10.4-5 shows the etch rate as a function of catalyst activity.6 We see that a plot of 1/D AC versus 1/a B should be a straight line.
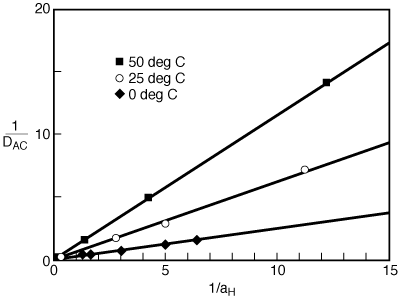
Figure CD10-18
Linearization of model for the catalyzed dissolution of kaolinite