
Social Vulnerability Assessments for Equitable Prioritization of Resources
Assessing social vulnerability to help predict recovery outcomes for vulnerable communities and prioritize aid distribution.
About the Recovery Social Vulnerability Index (rSVI)
Social vulnerability indexes are commonly used tools that help identify at risk populations. For our project, our team developed a vulnerability index that is specifically catered to recovery. This index includes variables related to disaster recovery, such as access to internet, as well as incorporates parcel level data.
To better understand the distributional relationship of vulnerability in St. Charles Parish, our team used maps to visualize both the census tract level and the parcel level recovery social vulnerability index (rSVI). These maps help us to understand where vulnerable populations are clustered near each other and help us to identify patterns in vulnerability. In addition, rSVI visualizations, in tandem with machine learning damage assessments, can provide a more holistic understanding of the social characteristics influencing individual capacity to recover.
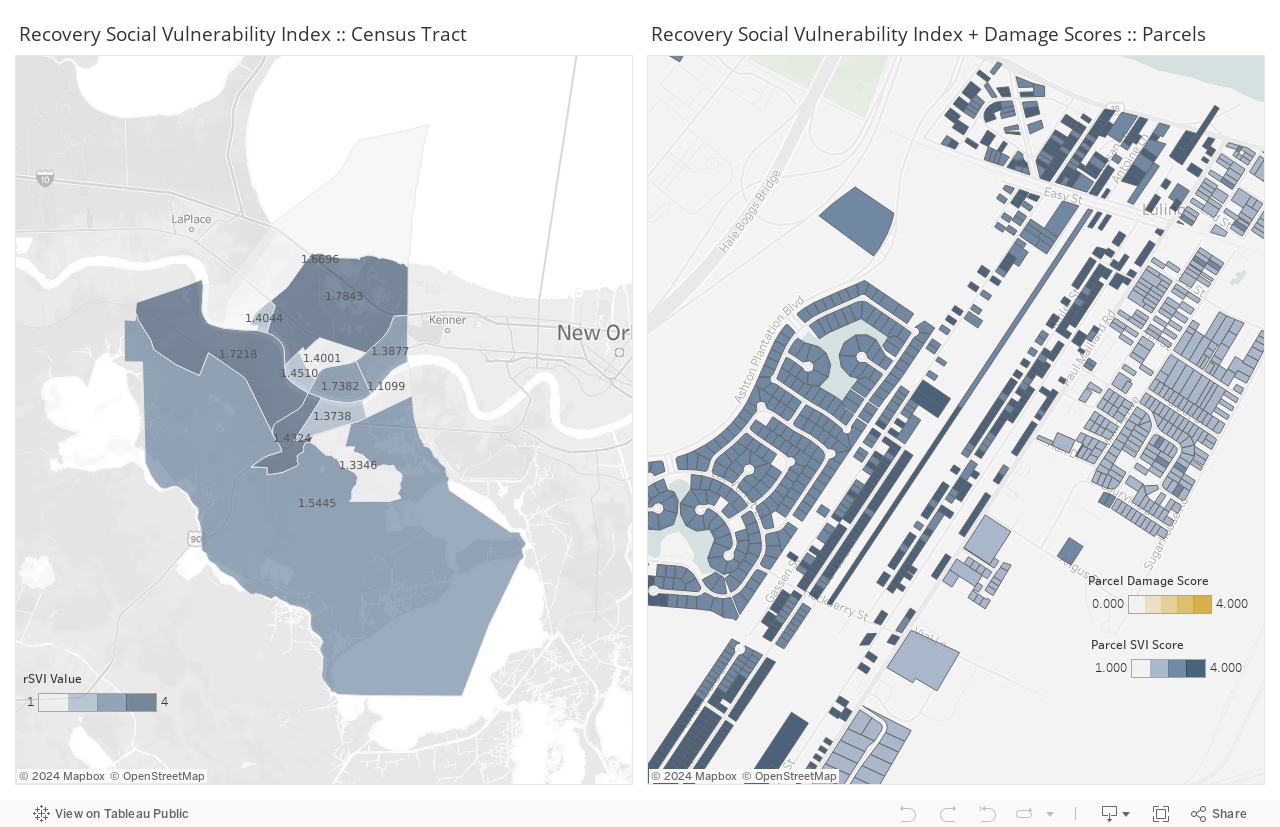
In the dashboard below are two maps that visualize the rSVI. On the left is the tract level index and on the right is the parcel level index. In both maps, darker blue indicates a high degree of vulnerability. On the parcel level map, damage assessments for each parcel can be toggled on and off by using the control map layers tool on the upper-left side of the map. This allows you to compare the actual damage to the structure to that household’s level of vulnerability.
The Recovery Social Vulnerability Index (rSVI)
Current SVIs used in the field of emergency management
National Disaster and Preparedness Center (NDPTC) incorporates the CDC SVI into their vulnerability assessment which predicts the vulnerability of damage to an area based on the SVI, the FEMA Hazus dataset, and other NOAA storm predictors. While this methodology is adequate for ascertaining a general sense of vulnerability, it is lacking in granularity of data due to the nature of large federal datasets. Additionally, the current CDC vulnerability framework is not specifically catered towards disaster recovery. Therefore, some variables pertinent to recovery are not included in the CDC social vulnerability index.
View the Complete rSVI documentation
Explore rSVI Variables
Our project used Hurricane Ida and St. Charles Parish in Louisiana as a case study for the piloting of this new rSVI methodology. Data was collected at either the census tract or parcellevel to simplify data aggregation and calculations.
18 social variables were chosen to create an rSVI specific to disaster recovery that would capture the variables that speak directly to a household or individual’s capacity to seek out recovery resources.

Additionally, as part of our vulnerability assessment process, these variables were built off of traditionally used census tract level measurements by also using parcel-level measurements. This decision was informed by interviews with emergency managers and damage assessors in St. Charles Parish who explained the drawbacks of census tract level data when used within larger, rural, and sparsely populated census tracts similar to those found in the New Orleans surrounding parish region.
Findings and SVI Comparisons
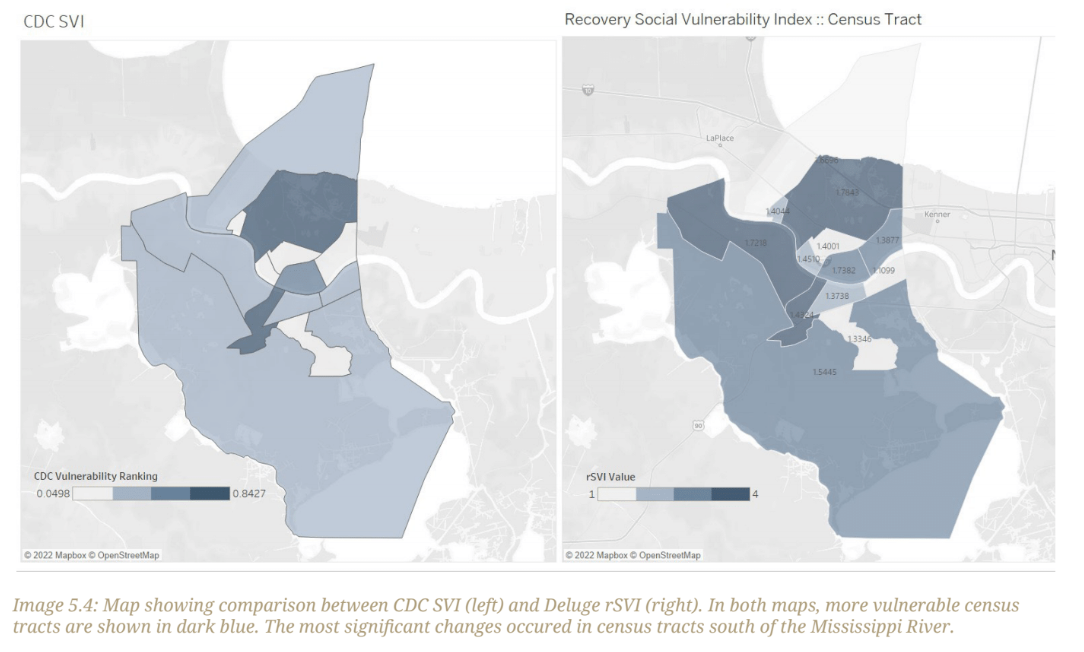
In general, the vulnerability index rankings for census tracts in St. Charles Parish, Louisiana increased when using the rSVI as compared to the CDC SVI. 5 out of 13 census tracts saw an increase in vulnerability rankings while only 2 decreased. It is most likely that the shift from comparing tracts nationally to regionally resulted in these changes in vulnerability assessment.
Therefore, to increase the efficacy of the social vulnerability index (SVI), it is necessary to integrate additional measures that add nuance to our understanding of vulnerability.
Incorporating an rSVI within Damage Assessment Models
Opportunities for machine learning, damage severity validation, and prioritization for aid distribution.
Together, analyzing calculated parcel rSVI scores with damage assessment data available
This can help provide an understanding of how, if at all, the vulnerability of a household impacts the amount of damage sustained by the structure. If the relationship is strongly correlated in a positive direction (i.e. the greater the vulnerability score, the greater the amount of damage we can expect to see to the structure) our rSVI could be used as a predictive model.
Planners and emergency managers can use the rSVI to predict which communities will be impacted the most by structural damage and where community residents have the least amount of resources available to help with recovery efforts. This can help to make recovery more equitable and faster for those who are traditionally slow to receive help from disaster relief and recovery agencies.
Applications for the RIDA+ Model
The rSVI should be deployed in the earliest phases of the RIDA+ process. After determining the likely storm trajectory for a given storm, rSVI calculations should be made for all census tracts and parcels within that storm path. Deployment of aerial imaging tools (drones, planes, etc) should be based on the most vulnerable tracts in the study area.
Within the most vulnerable and second most vulnerable tracts, deployment of streetview imaging should be based on parcel level rSVI. This will help to prioritize perishable data capture and analysis of the most at risk communities first.
The rSVI should be revisited at the end of a disaster recovery cycle to assess its efficacy in predicting the amount of damage sustained by homes. Revisiting the rSVI regularly also allows for data to be updated as new data becomes available.
