
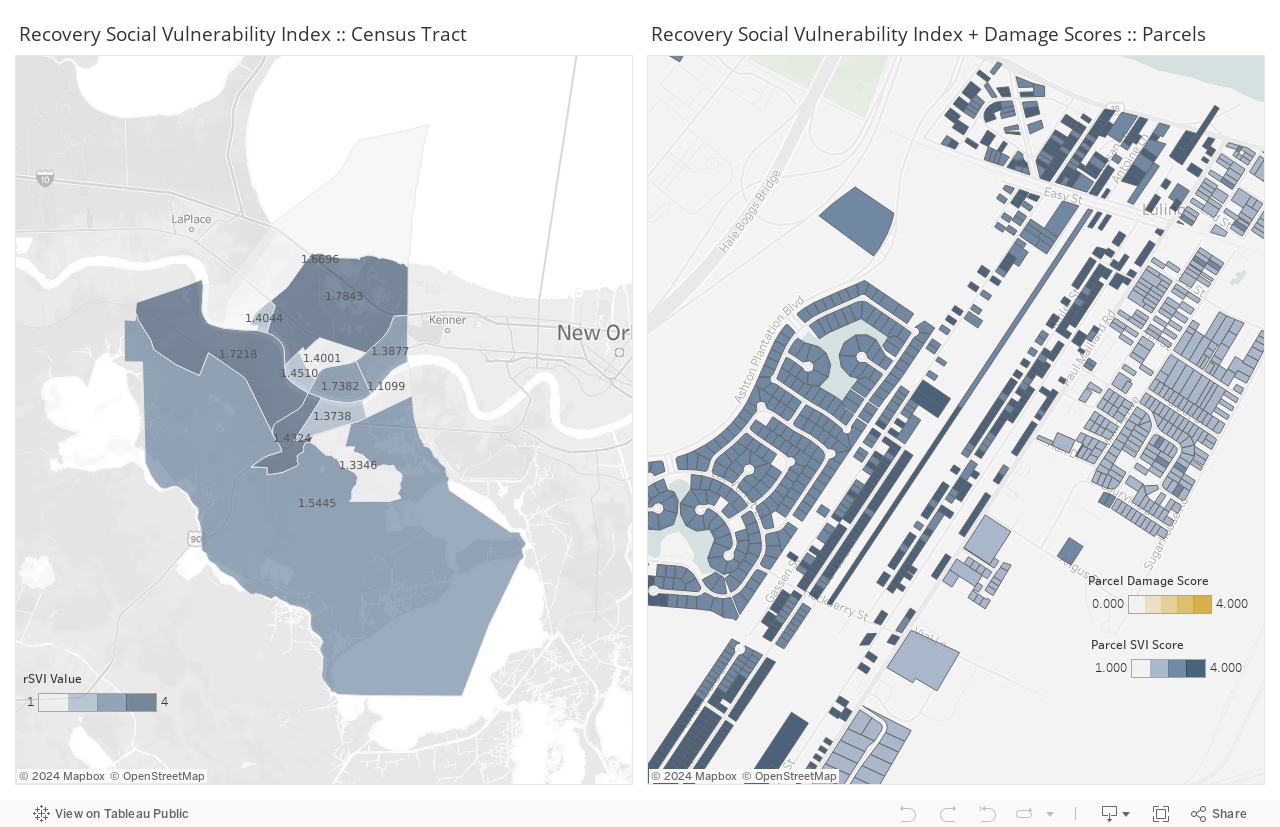
Social vulnerability indexes are commonly used tools that help identify at risk populations. For our project, our team developed a vulnerability index that is specifically catered to recovery. This index includes variables related to disaster recovery, such as access to internet, as well as incorporates parcel level data. Follow this link “ rSVI working paper” for a more complete description of the rSVI. To better understand the distributional relationship of vulnerability in St. Charles Parish, our team used maps to visualize both the census tract level and the parcel level recovery social vulnerability index (rSVI).
These maps help us to understand where vulnerable populations are clustered near each other and help us to identify patterns in vulnerability. In the dashboard below are two maps that visualize the rSVI. On the left is the tract level index and on the right is the parcel level index. In both maps, darker blue indicates a high degree of vulnerability. On the parcel level map, damage assessments for each parcel can be toggled on and off by using the control map layers tool on the upper-left side of the map. This allows you to compare the actual damage to the structure to that household’s level of vulnerability.

Rising Above the Deluge Capstone Team
University of Michigan
Taubman College
2000 Bonisteel Boulevard
Ann Arbor, MI 48109